
With chart patterns and on the basis of a broadly diversified portfolio, it is highly probable that money can be earned every year. Unlike in the USA, however, chart patterns have received little attention from investors in Germany to date. We live in the computer age and so the widespread opinion prevails that trading signals must be generated by computers in order to be accepted. This article is about how traders can generate positive returns using charting techniques regardless of the market environment.
Many investors believe that the bigger and faster a computer is, the better its buying and selling decisions. According to the author, this attitude is wrong. Otherwise, all major banks and investment firms would have to earn money for their customers every year. The fact is, however, that in the last ten years virtually none of the large equity funds has generated more than the fixed-term deposit return for customers. Even with some of the largest and best equity funds, some investors suffered losses in value of more than 50 percent in 2003 and 2008. With losses in value of this magnitude, it is virtually impossible for investors to achieve absolute return results with their investments, i.e. earn money every year.
Broker WH SelfInvest receives another outstanding rating from the German consumer institute.

- Order execution: 5 out of 5 stars. Score: "extremely good".
- Trading platform: 5 out of 5 stars. Score: "extremely good".
- Mobile platforms: 5 out of 5 stars. Score: "extremely good".
- Service quality: 5 out of 5 stars. Score: "extremely good".
- Order possibilities: 5 out of 5 stars. Score: "extremely good".
Test WH SelfInvest: free demo trading account.
Benchmarking
Many banks and asset managers find a simple solution to this problem: the keyword is "benchmarking", i.e. the comparison with a known index. This means nothing other than that the bank or asset management company can still proudly announce that it has done a good job in the interest of the investor, for example if the DAX falls by 50 percent and the loss in value in the investor's account, in contrast, is "only" 49 percent.
What many investors don't know, however, is that it takes little work to achieve trading results over time that are one to two percent better than the DAX or any other index. For banks and asset managers, however, the benchmarking strategy has the advantage that the investor can be charged management fees without great performance pressure and with little effort. This is why more and more investors are investing in Exchange Traded Funds (ETFs) instead of actively managed funds. Even with these passive investment instruments, almost as good results can be achieved as with benchmarking - but with considerably lower costs.
One of the reasons why equity funds had such a negative performance in 2003 and 2008 is that risk diversification no longer works well in very poor equity markets. We will explain later why risk diversification works better when buying and selling stocks, futures, currencies or other commodities on a chart basis.
While Technical Analysis has proven in the past that it can deliver Absolute Return results, Fundamental Analysis has failed completely in 2003, 2008 and the recent past. The problem for the investor with regard to technical analysis, however, is that the individual investor must find the one out of the multitude of funds that achieves absolute return results. The fund with the best performance this year may have poor results next year.
There are many differences between technical indicators and chart patterns, of which only the most important are mentioned here:
- Technical indicators work with a time lag, chart patterns work immediately.
- Technical indicators are optimized, chart patterns are not.
- Technical indicators are easy to use once programmed. Many chart patterns, on the other hand, are very difficult to program.
- Technical indicators can only be used with a computer, but most chart patterns can be analyzed manually.
- Chart patterns can dynamically adapt to constantly changing market conditions, technical indicators cannot.

Parameters for an Absolute Return Strategy
According to the author, the following parameters are the basis for an absolute return strategy:
The same trading approach must be applied to the various components in a portfolio without change, such as equities, futures, currencies, commodities, etcetera.
Every single product in the portfolio should have made a profit on historical test results almost every year.
Long and short positions should be possible.
Stop loss and profit target must be used for each position.
The trading approach, which is applied equally to all products, should not be optimized. In other words, only one parameter should be used to generate trading signals.
The opportunity/risk profile of an absolute return strategy with these parameters is particularly interesting if a portfolio is broadly diversified. If, on the other hand, you only have fixed-term deposits or long-dated bonds in your portfolio, you do not need to worry about the timing of the individual investments.
The importance of highs and lows
The author has been working with chart patterns for over 30 years. Why? Because investor behavior is one of the most stable elements in the analysis of price data. Investors around the globe are driving the prices of stocks, futures, currencies and commodities up and down with their different opinions. Highs and lows are formed by the investor behavior of individuals or by the investment decisions of computer models, whereby these were again developed by humans.
The highs and lows, no matter in which time unit one looks at them (daily data, intraday data, etc.), contain the level of knowledge of the sum of all investors at a certain point in time. The author is firmly convinced that the analysis of highs and lows alone is sufficient to achieve absolute return results.
This analysis should in any case be better than investment decisions made by investors based on news on the radio, television, Internet or the like. It should also be better than analyzing news about fundamental facts about individual companies. Why? All the news we hear or read every day is generally received too late. Fundamental news can be interesting for the long-term trend, but for the timing of an absolute return strategy it is rarely useful because it is too long-term.
Advantages and disadvantages of working with chart patterns
Certainly working with chart patterns can achieve similarly good trading results as the best computer programs used by the big trading houses or hedge funds. Chart patterns have been used very successfully in equity analysis for over 100 years, long before the first computers were developed. The best books on chart analysis were written many decades ago. If chart analysis has become "out of fashion" these days, there are several reasons for it:
Chart patterns often have to be drawn by hand and are therefore not as accurate as computer analysis. In order to achieve the best results with chart patterns, the investor should use specially designed software.
Chart analysis is hard work. Most investors want to make as much money as possible as quickly as possible, but are not prepared to work extremely hard for this success. The reason is that there are such easy-to-use technical indicators. Experience shows, however, that most technical indicators are not worth their money.
Working with chart patterns requires a great deal of knowledge. There are a variety of chart patterns, but few are suitable for achieving Absolute Return results.
What makes working with chart patterns so difficult?
Working with chart patterns requires skill. Regardless of how user-friendly chart design software is, the investor must be able to link trend channels, trend lines, or a Phi ellipse, for example, to highs and lows as accurately as required by the chosen strategy.
Discipline and patience are also critical. The biggest problem with working with chart patterns is that you have to wait until they have developed. Looking back, it's easy to identify chart patterns, but it takes a lot of discipline and patience to wait for chart patterns to complete in real time trading. The more chart patterns we have chosen for trading, the more difficult it becomes to track them over time. For this reason, it is advisable to focus on a few chart patterns and only those that offer a high probability of absolute return results.
From the large number of chart patterns available to the investor for analysis, there is now a small selection of patterns that can produce good trading results if applied correctly. These are:
- Trend Lines and Trend Channels.
- Resistance and Support Lines.
- Phi Ellipses.
Absolute return results with trend lines and trend channels.
3-point trend lines
Trading with rising and falling trend lines is a strategy that is always against the direction of the main trend. The slope of the trend line can range from very strong to very weak. A short signal is generated:
- at the end of an uptrend.
- when the trend line (based on three rising lows) is touched (2-bar-lows). A 2-bar low has two days with higher lows to the left and right of the day with the lowest price. We choose 2-bar lows because they allow the trend line to be defined very precisely.
Image 1 shows that a short signal is produced when low 3 is broken by the downward price trend. After the short signal is executed, the stop loss is placed a tick above the highest high. The same strategy applies vice versa for a long signal:
- A long signal results at the end of a downward trend or
- when the trend line touches three lower highs (2-bar highs). We choose 2-bar highs because this allows the trend line to be defined very precisely (a 2-bar high has two lower highs to the left and right of the day with the highest price).
Image 1: 3-point trend lines Short signal
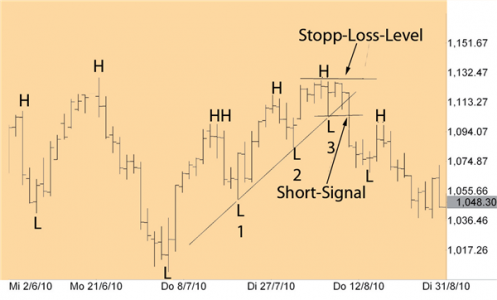
Image 1: The 3-point trend line based on 2-bar highest-lowest points is rarely found in daily data. Once it does occur, however, it is a very helpful and profitable trading tool. The advantages lie in its simplicity and in its appearance in all trading instruments with volume and volatility.
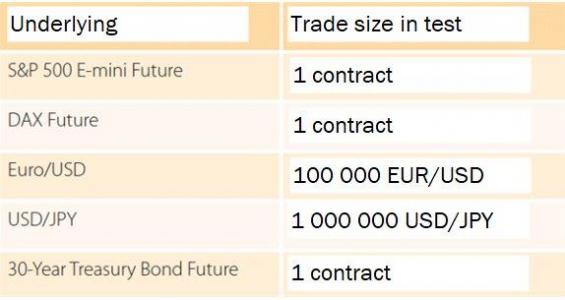
Table 1: Base values used in the test
4-point trend channels
For a trend channel in the downtrend, we first need to look for a trend line that touches three falling 2-bar lows. A parallel is drawn to this falling trend line, leading through the high above the lows (on the right side of the trend line). Figure 2 shows an example of this signal.
- Step 1: We start the trend channel in the downtrend with the falling trend line formed by three falling 2-bar-lows. We choose 2-bar lows because this allows the trend line to be defined very precisely. We have marked the three falling lows in picture 2 with points 1, 2 and 3. As soon as the trend line with the three falling lows is established, we draw the inner trend line as a parallel to the outer trend line through the high A.
- Step 2: As soon as the market price moves up from low 3 and breaks through the upper trendline, we receive a buy-signal (point B in figure 2).
- Step 3: As soon as we have received a buy-signal, we place the stop-loss one tick below the low point of 3. For a short-signal, we start with a rising trend channel.
Image 2: 4-point trend channel long
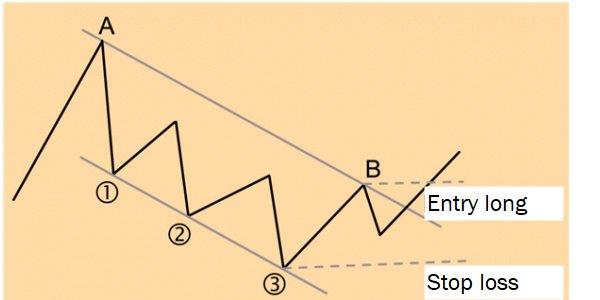
Image 2: The 4-point trend channel is very well suited as a trading tool because it can adapt dynamically to the price changes of individual products. It can be used almost everywhere for trading instruments with a high volume and high volatility. A disadvantage may arise in the case of strong, long-lasting trends in which much of the book profit can be relinquished.
Broker WH SelfInvest receives another outstanding rating from the German consumer institute.
- Order execution: 5 out of 5 stars. Score: "extremely good".
- Trading platform: 5 out of 5 stars. Score: "extremely good".
- Mobile platforms: 5 out of 5 stars. Score: "extremely good".
- Service quality: 5 out of 5 stars. Score: "extremely good".
- Order possibilities: 5 out of 5 stars. Score: "extremely good".
Test WH SelfInvest: free demo trading account.
Dynamic adjustment of trend channels
What makes working with trend channels so interesting is that they can adapt dynamically to price changes. If the price breaks up after a buy signal from the upper trendline of the trend channel, this can be seen as a strong sign that another price increase is imminent. After a price breakout to the upside, a higher high must inevitably form. By this higher high (HH) a new trend channel can be drawn - with a stronger rising angle. Figure 3 shows an example of how a trend channel can dynamically adjust to the rising price trend in a strong uptrend. In a downward trend, the trend channel can also adapt dynamically to falling prices.
The 4-point trend channel can be applied to all products with volume and volatility. Its strength lies in the fact that it can be applied to both up and down trends. Due to the ability of trend channels to dynamically adjust to price changes, the holding period of a trade can be very short or very long, depending on the market phase we are in.
The weakness of the 4-point trend channel is that in a strong trend, the inner line of the trend channel, that is, the trend line leading through point A, can be very far from the current market price. This could mean that if we wait for the price to break through the inner trend line, we could lose a large part of the open profit.
Figure 3: Dynamic adjustment of a trend channel
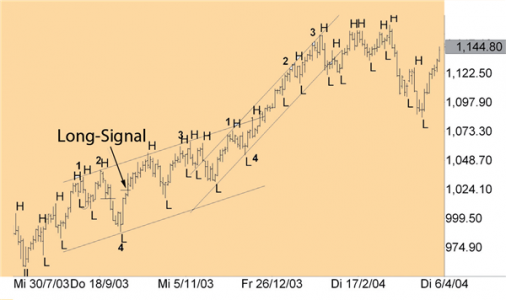
Image 3: The biggest advantage of working with 4-point trend channels is their ability to dynamically adjust price changes to strong trends better than any technical indicator - both up and down trends.
5-point trend channels
In order to remain as close as possible to the signal line of the current price trend in a strong trend, it is advisable to adjust the inner line of the trend channel to the price trend under certain conditions. Figure 4 shows how the 4-point trend channel can become a 5-point trend channel.
The 5-point trend channel is a special case. It always gains importance in strong, long-lasting trends. As can be seen in Figure 4, in a downward trend the trend line that runs through point 4 can be shifted to the left to the two highs A and B. The trend line can be shifted to the left to the two highs A and B in a downward trend. The same applies to the uptrend as well.
Conditions for achieving Absolute Return results
But one question remains: When can you trust test results based on historical test data? If the investor is only interested in the results with historical data, then every black box system comes up with very good test results. However, only the results in real-time trading count. So the question is: when can you trust historical results to the extent that real time trading results are about the same as historical results?
What makes the computerization of trend lines and trend channels so difficult is the identification of the "right" highs and lows. In the examples discussed here, there is also the combination of trading signals from 3-point trend lines and 4-point or 5-point trend channels. The signals from the combination of trend lines and trend channels can be easily traced by an experienced chart technician if a good software package is available.
The strategy to generate trading signals with trend lines and trend channels fulfills exactly our ideas, which are necessary for an absolute return strategy - only the complete programming in a computer program is very difficult to implement.
Image 4: 5-point trend channel
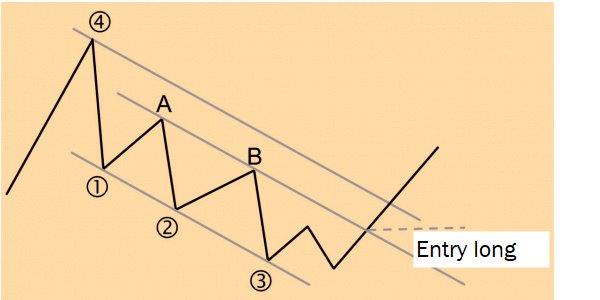
Image 4: The disadvantage of the 4-point trend channels that in strong trend phases they might have to give away a lot of the book profit during a trend reversal is strongly reduced by the 5-point trend channel, since it includes the inner trend channel, which is characterized by points A and B. The 4-point trend channel is also characterized by the 5-point trend channel.
Simulation of trading signals based on historical test data
We use software to test trading signals with chart patterns based on historical data. This software has been used since 1996 to test the trading signals of the underlyings listed in Table 2. The test series are important to determine whether the trading signals are profitable over such a long period of time.
Table 2: Trading signals in the underlyings used
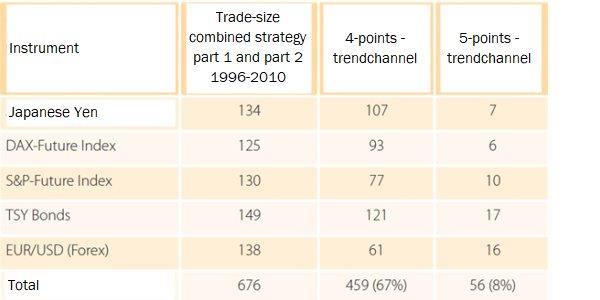
Table 2: shows the trading signals in the products generated by working with trend lines and trend channels. In the first column the sum of all trading signals from the work with 3-point, 4-point, and 5-point trend channels is summarized.
Even more important, however, is the determination of a suitable stop loss and a favorable profit target. In order to find out which stop-loss marks and profit targets make sense, you should first run the test series without stops and profit targets. If these results are already good enough, you should only look for the stop-loss that is used as the last safety marker. In any case, you should avoid diluting the original trading results by over-optimizing the stop-loss markers and profit targets. Trend lines and trend channels
generate the best trading results if you can follow both long and short signals and diversify onto different products that are as uncorrelated as possible.
Table 3 shows the net result of all trading signals in the products listed in Table 2, the maximum loss in value, and so on. For each underlying asset and for each trade (meaning a round-turn transaction, i.e. entry and exit), 80 euros were calculated to take into account commissions and slippage. If you take a closer look at the sum of the trading results, you will see that each year a profit was made and thus the goal of Absolute Return results was achieved.
Table 3: Performance Report Chart Technique Trading

Table 3: Net result of the five trading products analysed using trend lines and trend channels.
Importance of diversification
Diversification works best when the products in the portfolio are as uncorrelated as possible (i.e. statistically independent of each other) and all products are analysed with the same trading strategy. For this reason, trading results generated on the basis of chart patterns can be so successful.
Reliability
Surely it is a disadvantage that the signals cannot be fully automated and it ultimately depends on the skill, knowledge and patience of the investor working with these strategies. For the good chart technician, however, the advantages outweigh the disadvantages, as he can draw the corresponding lines and determine from historical data whether the strategy presented here works or not.
To ensure that any interested investor can understand how the author generates the trading signals with trend lines and channels, he has published each signal on the website of his book by John Wiley. Surely many investors will ask the legitimate question why trading signals are published at all when they are so good. The fact is that the community of die-hard chartists is very small compared to the multitude of investors using technical indicators. Since the author is invested in products with a huge daily volume, the signals from chartists with this rate will never affect the market.
A concrete application of the chart technique and at the same time the most interesting instrument for achieving absolute return results is the Phi ellipse. This will be presented in detail as a strategy article in one of the next issues.
