As with all correction patterns we present to you within this series of articles, a trend is also the most important prerequisite for wedge formation. Only if you know in which direction the price trend is going can you look for the appropriate correction patterns. That's why we're taking a short trip into the world of trend determination at this point.
Determination of trends
In the search for trends, several paths lead to the goal. The easiest way is certainly still the classic visual inspection. Especially when you start trading, old-school trend analysis can help to train the eye and learn to understand the behavior of traders. But in today's everyday life, where not only a few dozen company charts, but many hundreds to thousands of values have to be examined for existing trends, you can and should be supported by modern technology. For example, with the help of Moving Averages (MA) you can make simple statements about the trend direction. If the price of a stock is quoted above a certain average, it is an upward market. However, if the stock is traded below the selected MA, it is a downward market. Depending on market proximity - the closer, the more active the trade - you can commit yourself to a certain time frame.
In general, the following rule of thumb can be used:
- MA over 20 days = short-term trend
- MA over 50 or 100 days = medium-term trend
- MA over 200 days = long-term trend
In order to give a little more quality to this simple type of trend determination, it has proved very useful in practice to add one or two further criteria to the selected MA in addition to the price location. For example, you can make sure that in short-term trade the MA(20) quotes above the MA(50). Or you can specify that the MA of your choice must have risen over a certain number of periods (e.g. 20) in an upward trend. The same applies vice versa to a downward trend.
Wedge formations
Wedge formations are divided into two categories. There are falling and rising wedges that occur in both rising and falling trends. If they are analysed as trend continuation formations, they should be used for trading in trend direction. The wedge is very similar in shape to the symmetric triangle that we will discuss in more detail in a later article. The visualization is achieved by connecting the high points on the upper side and the low points of the candles on the lower side with a line within the correction. This creates two trend lines, which converge in the course and meet at the end in a peak. The resulting narrowing indicates that buyers and sellers become active earlier and earlier.
Falling wedges
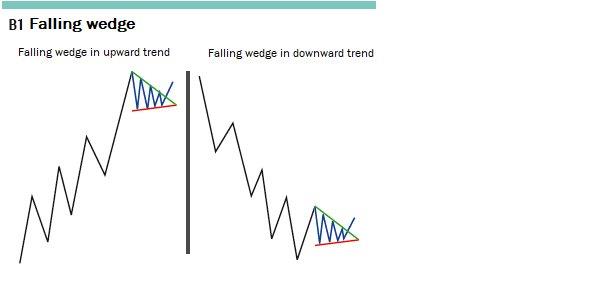
As a rule, a falling wedge (pic. 1) is dissolved upwards and thus belongs to the fraction of bullish signals. Optically, the formation is characterized by the fact that we see clearly falling highs, while in relation to this the rising lows within the pattern are closer to each other. From this behavior, we can see that the market is visibly slowing the price losses downwards, which speaks for a decline in selling interest, and thus the upward pressure is increasing more and more. If a falling wedge occurs within an upward trend, it represents a trend continuation formation. This correction is often preceded by a strong price increase. Identification within a downward trend is somewhat more difficult. The wedge does not represent a correction here, but is part of the trend development, in which the spread between the trend lows decreases. The breakout from the formation to the upside often represents a break in the trend, which can be followed by an upward trend in the aftermath.
Source: www.investorschule.de
Image 1:Shown is the ideal typical behaviour when a falling wedge is formed in an up- and downtrend. The lower, flatter line represents the bottom for a later price increase. The steeper falling upper resistance line narrows the price range between the wedge sides and thus builds up a tension environment, which is usually reduced by the breakout on the upper side.
Rising wedges
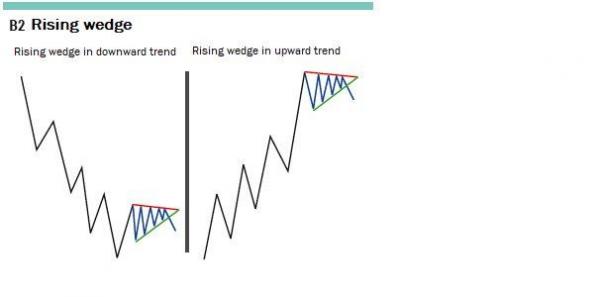
Rising wedges (Image 2) represent a chart formation that is considered to be declining. They are formed by a sequence of partially rising heights on the top and rising depths on the bottom. The narrowing of the price range here comes from below, which is why the pressure of the market usually drops downwards. Therefore, the dissolution of a rising wedge usually takes place by leaving the pattern via the underside and thus leads to further falling prices. In most cases, rising wedges can be found as correction patterns in downward trends. However, it happens from time to time that they occur within upward trends. In this case, special caution is advised with long trades. If a rising wedge is formed within an uptrend, this bearish sign could lead to the end of the trend or indicate an imminent trend reversal.
Source: www.investorschule.de
Image 2 shows the ideal typical behavior with a rising wedge in the up and down trend. A special feature is the significantly steeper rising wedge underside compared to the wedge top. From this behavior it becomes apparent that the ever earlier onset of purchases leads to rising highs, but that there is no buying pressure on the upper side. This is a sign of weakness and opens the door for falling prices after the dissolution of the wedge over the underside.
Role of volume
When assessing the significance of wedge formations, the development of the trading volume should always be taken into account. There is a good overview of how sustainable the further price development could be. A high trading volume within ever smaller trading margins is usually not a good omen for a strong movement after the correction pattern has been resolved. In these situations, breakouts are often used to close existing positions. It is much better, however, if during the time in which the wedge forms, the trading volume gives way clearly. This is a sign that the restless hands are out of the market. In many cases, an outbreak on the desired side then attracts further traders into the market who consider dissolving the wedge in the sense of trend trading in order to build up or expand positions.
Breakout signal of a falling wedge in a downward trend
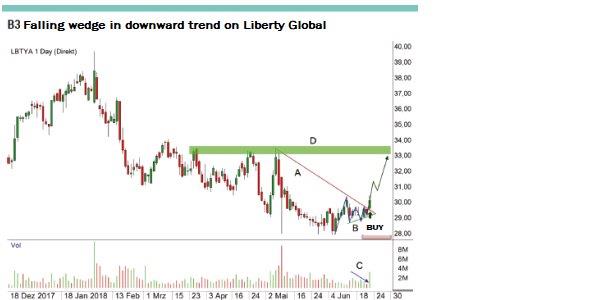
The chart of Liberty Global (Fig. 3) shows a downward trend from a high of 37 US dollars to 28 U.S. dollars. After the bottom formation in the area of the low, a wedge formed after an initial upward movement, whose prices fell noticeably on the upper side, while there was less and less selling pressure on the lower side. Looking at the trading volume, it appears that there was a decline during the formation of the wedge. This generated the trading idea that a breakout from this pattern under high volume could lead to an upward trend on the one hand; on the other hand, a first target range around the price level of 33.50 US dollars can be seen on the chart. After the breakout above the upper line of the wedge took place on 22.06.2018, the initial position at 29.80 US dollars was opened. The opening of the trade was also supported by the high trading volume on this day - already evident in the smaller time units. To limit the risk, the hedging freeze was placed just below the 29 US dollar mark at 28.98 US dollars.
Source: AgenaTrader
Image 3: The figure illustrates the formation of a falling wedge within a larger downward trend. Looking at the chart pattern, it can be seen that the resistance line A on the upper side of the wedge is steeper than the support area B. The downward trend is shown in the chart. The trading volume C is decreasing during formation and the breakout above the top of the wedge takes place under high volume. A possible starting point for the profit planning is the price range D.
Formation of falling wedge in an upward trend
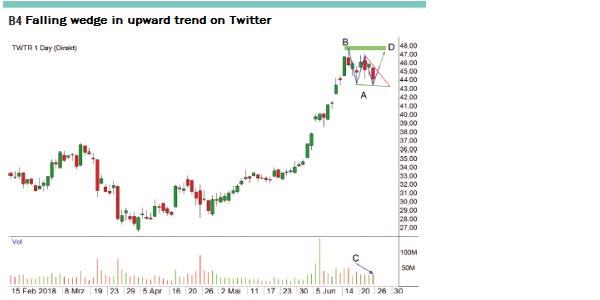
After the Twitter share (Pic. 4) showed a high upward momentum under strong volume at the beginning of June 2018, the value began to consolidate after reaching a high of 48 US dollars. It was characterized by the fact that a bottom appeared to be forming around the 43.30 US dollar range, while prices on the upper side continued to fall. This led to the creation of a tense environment, which often dissolves in the trend direction with this price pattern. Trading volumes also declined slightly, which was a positive sign. A trading idea could be developed from this network of information: If there is a breakout on the upper side, it is very likely that prices will initially rise into the range of the current trend high of 48 US dollars. On the way there, further buyers could wait around the 47-dollar mark, whose opening of positions could lead to increased demand and thus rising prices. The position will be opened when the breakout takes place above the wedge top. A rising trading volume would be advantageous. The area on the underside of the wedge around 43.20 US dollars serves as a hedge.
Source: AgenaTrader
Image 4: The chart shows the formation of a falling wedge within an upward trend. Line A represents the flat underside and line B the clearly falling upper side of the formation. The trading volume C is declining as desired. In case of a breakout above the upper side B of the wedge, the current trend high D is likely to start.
Conclusion
Even if the wedge pattern cannot be seen quite as often within chart progressions as other formations, it is still worth paying attention to it. Because wedges combine two interesting characteristics that successful traders appreciate: They serve both as trend continuation indicators and trend reversal indicators.
Courtesy of TRADERS´: www.traders-mag.com and Mike Seidl