Trading based on price patterns can offer excellent low-risk and high profitability opportunities. Recurring formations can be easily recognized and backtested for profitability. This way, the patterns in this presentation not only evokes associations with the Austrian flag, but could also increase your holiday budget. This article shows how you can use it to your advantage.
Are you looking for an outstanding futures and CFD-Forex broker?

In the annual Brokerwahl traders voted WH SelfInvest as "Nr. 1 Futures Broker" and "Nr. 2 CFD Broker". For an incredible five times in six years WH SelfInvest is considered the best futures broker, beating all competitors by a wide margin. In CFDs WHSelfInvest came only 0,1 behind this year's first-placed broker. Clients are extremely satisfied with the low commissions, outstanding order execution and the legendary service.
Test WH SelfInvest, download a free demo.
PATTERN SAMPLE
Price patterns are generally regarded as highly profitable investment strategies. You will hardly find a trading professional who does not incorporate the conclusions resulting from the recurring formations into his trading decisions.
The most commonly known price pattern is probably the candlestick pattern "Hammer". It describes the behaviour of the market on a given day and indicates where and how open/high/low/close are arranged on the price scale. This in turn allows to draw conclusions about market behaviour on the following day.
A hammer is a day in the downtrend which could lead to a trend reversal. The day begins weakly, new lows are formed in the course of trading, but then the turnaround comes, the market makes up the lost ground and closes near the opening. The chartist doesn't care what this reversal of the market direction has initiated, the only important thing is that the market has moved away from its daily low and closes where it has already opened.
Picture1 shows this candlestick pattern.

This means the following for the next day: If the market manages to further go up and exceed the previous day's high, then this is a strong bullish sign and we can think about a long position. However, if the market starts to fall again and forms new lows, then the intraday trend reversal of the hammer was too early. If you are already long, you should close the position at the bottom of the hammer at the latest.
So a price pattern is nothing more than a good way to indicate exactly where to place the entry and exit stops. Knowing where to put stops, the position size can then also be selected correctly - and that is the key to successful trading.
RED WHITE RED
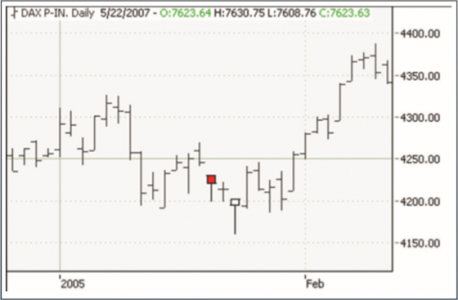
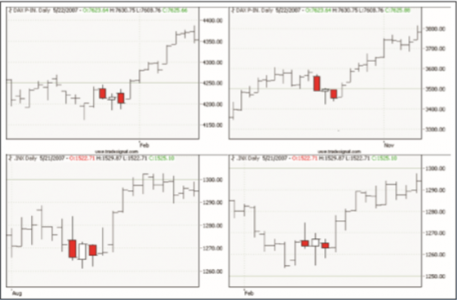
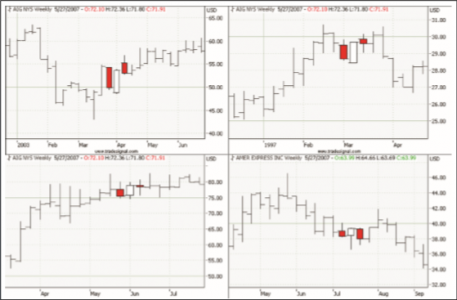
The red-white-red pattern is a price pattern that comprises a total of three days, i.e. not only describes the market behavior on one day, but also determines the exact sequence of the price development on three consecutive days. The first day of the price pattern is a falling day, represented on the chart by a red candle. This negative day is followed by a short recovery after new lows, the market can close on day two of the price pattern above its opening. This day must be the lowest of the three days. A negative day follows on the last day of the price pattern. The previous day's correction is over, but the bears are not so strong that they could push prices below the previous day's low, the market must trade above the low of the white candle all day, but close below its opening. Picture 2 shows several examples of this pattern. The two upper charts show the DAX30 index, the two lower charts the S&P500 index.
Picture 2: Price pattern red-white-red. Picture 2 shows the appearance of the price pattern in the DAX30 and S&P500 indices. The red-white-red pattern consists of a total of three days. The first and the last day close under its opening, the middle day forms the lowest low of the group of three and closes above the opening price. If the high of the last two days is exceeded, then after three days of indecision a further breakout upwards is to be expected. In combination with the right position size and a sound exit plan, this pattern can be used profitably for trading.

ENTRY
With the definition of the pattern you know the setup, however, in order to be able to earn money with such a price pattern, you still have to determine where exactly the position has to be entered, the size of the position and when the position, hopefully with an nice profit, will be closed again. The price pattern itself, and this applies to all types of price patterns, is not yet a sufficient reason to jump into the market immediately and build up a position. First the market has to confirm the idea, so it has to show that it will follow the red, white and red pattern with the expected upward movement.
Only when the market exceeds the high of the last two candles, i.e. the bulls have clearly taken the lead again, it's time to enter a long trade.
Trade price patterns on the award-winning NanoTrader platform.

"The NanoTrader platform is magnificent." – Kai
"NanoTrader is my fourth trading platform and it is by far the BEST platform." – Henry
"I have already familiarized myself a little bit with the platform and I can tell you, that it is the best trading platform I have ever used." – Peter
If the market rises above this point and thus forms a new high, then one can no longer speak of selling pressure. After three undecided days, the market seems to have agreed on one direction again. In addition, the low of the white candle of the formation was confirmed by the new high as Swing Low.
Practically you can realize this entry by usinga stop-buy order valid for the following day to your broker on the high of the last two days. However, only enter the market if it has not already opened with a gap above the formation.
POSITION SIZE
The dose makes the difference between poison or medicine, Paracelsus already knew that, and it is similar for traders when we have to determine on the size of a position.
Before you think about how many contracts to buy, you have to think about where our trading idea turns out to be wrong and we have to close the trade in loss. So we need to define our initial stop and set the maximum possible point loss for that trade.
As an entry point, we had decided to go into the market as soon as we saw that new highs were being formed. If the new high turns out to be a bull trap and the market falls below the low of the white candle, then it is clear that the pattern did not work in this case and we have to close the position again. The spread between the high of the last two days (= entry point) and the low of the formation (= worst case exit) is therefore the risk we take when trading this formation.
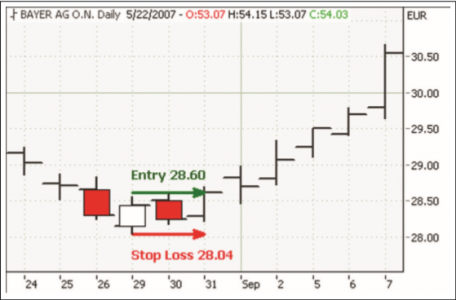
In order to determine the number of contracts to be bought from these two values, we remember the old money management rule that says that you should never risk more than one percent of your trading account in a trade. The number of contracts to be bought is therefore determined by the equation: Number of contracts= 0.01*trading account / (Entry level - Exit level). Picture 3 shows this procedure.
Picture 3: Position size. The picture shows a possible entry into a long position at the high of the last two candles of the price pattern. The worst case scenario for the first day is when the market takes the old highs, then turns and falls below the low of the formation. The low of the formation is the stop point for the long trade. The position size results from the risk of the trade (28.60 - 28.04 = 0,56€) and the account size. If you want to trade this pattern with a 10 000€ trading account, for example, you would risk 1 percent of your capital if you trade 10 000*1% / 0.56 = 180 contracts.
This ensures that you do not ruin your portfolio even in the event of several consecutive loss trades; on the other hand, the size of the position is large enough to assure a proportional gain in case of a profit trade.
EXIT
I have shown you so far how the red-white-red pattern is recognized, how big the position should be, when you should go into the market and where the initial stop should be placed. We haven't talked about taking profit, only the risk is under control. The next step is to show you how to keep the losses small, let the profits run and trade this formation with a positive result.
The entry is usually only a very small building block on the way to a successful trade, the money is earned with the exit, and so we need to pay attention to this. If you test the presented approach yourself, you will quickly see that you can also combine this exit with other price patterns and entrys.
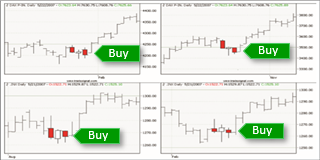
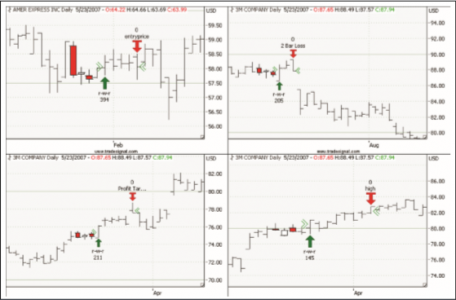
Successful patterns can be seen on the chart immediately afterwards, I would now like to show you a few examples in picture 4 where this pattern would not have worked. These examples are much more important for the development of the exit than those where the pattern worked as planned. From them you learn what can happen, and in the next step you can determine the method with which you can get out of such negative examples with the least possible damage.
Picture 4: If it doesn't work. Picture 4 shows you four examples in which the price pattern was not followed by the expected sustained upward movement. Clockwise: In example 1, the market could only take a high one day after the pattern occurred. It then stagnated at a high level. Example 2 shows the case where the market passed the formation on the first day, but then reversed and fell below the low of the formation. Example 3 shows a similar problem to example 1, the market cannot decide to go up. Example 4 is similar to example 2, after two days the market turns and begins to fall. An intelligent exit should be able to limit losses in such situations.
The cases in which the market explodes after the appearance of the pattern are not further difficult to trade (see picture 2). Waiting and counting money, but what if it doesn't go up? Always wait until we are stopped out at the bottom of the formation or realize earlier that this time it will be nothing?
We already had the first exit - the initial stop at the low of the formation. The next exit deals with the case that we don't see the low of the formation, but the market doesn't start to rise either. So we would be trapped in the position. To avoid this, I close the position if it is not positive two days after the entry at the end of trading.
The purpose of this is to eliminate the time risk. The longer you are in the market, the higher the risk is that something will happen to your disadvantage. Originally, the idea was that the market would move strongly upwards after this formation. If it doesn't, something was wrong in our analysis and it is usually better to end the trade and realize small losses than to wait for luck and be exposed to the danger of being stopped with the worst case loss at the bottom of the formation.
With these two exits, and tests with a stock basket from the Dow30 and DAX30 stocks show this, you at least manage to survive. The strategy does not throw off any money yet, but the losses are limited. Now you can only do it better.
The second exit further reduced the risk and addressed those cases where the market did not tend further upward. There is still another risk before we consider taking profits.
What if the market goes up for a few days but then turns around and starts to fall? Exit No. 3 is intended for this case. It becomes active from the third day of the trade and closes the trade when the market falls back to the entry price. Nothing is gained, but nothing is lost, and this is often a small gain.
With these three exits and the right position size you have the risk under control as far as possible, now we can think about how and when we realize profits.
The first profit taking exit is a simple profit target. The profit is automatically realized when the trade has taken three times the initial risk. The initial risk was the distance from the low of the white candle to the high of the last two candles in the formation (picture 3).
You can also work with a lower target. This increases the hit rate in sideways markets, as the target is repeatedly triggered by random movements, but prevents larger gains in trend phases. If you already have a trend-following strategy in place, this can be a sensible way, otherwise I wouldn't choose the target smaller than twice the original risk.
If the target is not reached within about six days, I try to exit at the high of the previous day. This usually brings a few extra points of profit compared to the ability to close the trade after a fixed period of time. It is also conceivable that you may not wait a fixed number of days for this exit, but try to get out to the high of the previous day as soon as no new high has arisen for one or two days. The exit at the entry price always remains active for the worst-case scenario. Picture 5 shows what these exits look like in practice.
Picture 5 : Exits. Picture 5 shows you various options for getting out of the position. In the first case, the position is closed after four days at the entry price. This has prevented the exit at the bottom of the formation. Example 2 shows the lucky case of the time exit. Since the position was not in profit two days after the entry, it was closed. Example 3 shows how useful a profit target can be. The high opening was used for the exit as it was more than three times the original risk above the entry. In example 4, the position is closed after six days at the high of the previous day (clockwise). The position size was chosen so that the same money risk was taken for each trade (see picture 3).
CONCLUSIONS
The article showed you a supposedly meaningful price pattern and a technique on how to trade this pattern. This technique can be extended in many ways and combined with other formations and entry ideas. The presented exits show how important it is to get the risk of a trade under control as quickly as possible. You need to be careful in your trades to end all those that do not develop as intended. This includes not only the losers, but also those cases where the market only tends sideways after the expected breakout. Time is also a risk and if the trade does not develop as planned, it is usually best to realize the small losses and wait for the next opportunity.
