Often the market is showing strong volatility when corporate news or macroeconomic data is released. Since almost all traders interested in a certain underlying value follow the corresponding news and many of these traders actively trade the events, volumes and emotions for these events increase particularly strongly. "No price in the world will always rise or fall, the reaction is exaggerated," could be their opinion about the sometimes immense moves. The following trading approach quantifies this initial situation with the help of various technical indicators based on volume and price and tries to create a setup that is as suitable as possible for timing short-term anti-cyclical speculation.
How exactly?
We look at the last five price units and the last price unit and want to see a strongly falling or rising trend in both time units. It should be recognized when the market is ready to march in the opposite direction at short notice - and with the best possible forecast quality. The strategy is based on two fundamental assumptions: The price itself has risen or fallen "unusually" on the basis of five price units and the last price unit. The quantification of "unusually" is based on the standard deviation - also on the basis of the last five price units. In addition, we would like to see this rise or sell-off if on the previous trading day "exceptionally" many players decided to trade old and new positions.
Indicator 1: Volume
First of all, a high volume must be precisely defined. As a general assessment, Moving Averages (MA) are very well suited to compare current trading activity with the previous volume. A simple MA over 20 days (20d-SMA) serves the purpose of a medium-term estimate for determining current turnover. The linear regression line on the volume data serves as a further indicator for the classification of the current activity. It can be used to determine a statistical "equilibrium value". The previous three volume units are to be included in the calculation of the line so that a short-term and rapidly reacting indicator can be used to estimate the current volume. If the trading volume exceeds the "focus" of the last three price units, an overreaction, i.e. a conspicuously high activity of the market participants, is assumed. This is the second deviation from the determination of extraordinary volumes.
Volume statistics with regression line and 20d SMA
What happens when and how often? If certain indicators are used for a trading system, it makes sense to examine them in advance according to specific criteria. This will identify certain characteristics and optimize indicator settings, which will facilitate the preparation and follow-up of trades and the selection of indicators for favorite underlying securities. Ideally, signal generation and future price behavior can then be predicted more precisely. Table 1 shows some evaluations of the volume indicator just described.
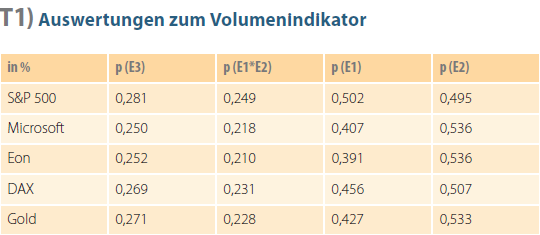
Table 1 (T 1): p: Expected value interpreted as probability, E1: volume > 20d-MA (volume), E2: volume > 3d-linear regression line (volume), E3: volume > 20d-MA (volume) and 3d-linear regression line (volume). The individual probabilities of E1 and E2 multiplied by each other give the assumed probability that both events, i.e. a trading volume above the 20-day average in the volume as well as above the 3-day regression line, will occur. In reality, however, this happens much more frequently. p (E3) represents the expected value with which this fulfilled condition is fulfilled in the respective base security for a potential trade. Without further criteria, the conditions of a high volume calculated according to this method are fulfilled approximately on every fourth trading day. In addition, it can be seen that the market tends to remain high at high volumes above the 20d SMA and tends to remain above the "equilibrium value" in volume much more often than would be expected compared to the previous three trading days.
Indicator 2: Momentum (1 and 5)
The momentum (or rate of change) should also be pro forma anchored in the chart. Volume breakouts, which are accompanied by a positive momentum based on one and five units, trigger short signals - and vice versa.

Click here for a real-time demo of the NanoTrader platform.
Indicator 3: standard deviation (5)
In addition to increased sales and prices, which clearly tend to move in one direction in the short term, the third indicator - the standard deviation (SDV) - should also assume a relative extreme condition. On the basis of five trading units (comparable to Momentum), the percentage value of the standard deviation should be above the X mark - and have risen in comparison to the previous price unit. In the following examples, a relatively low value of one percent was used.
The Entry Setup
The initial setup is variable. Image 1 shows the "base variant" with regression line and 20d SMA on the volume, with momentum in percent based on one and five days, and with a standard deviation in percent based on the previous five price units. The best possible indicator settings depend, of course, on the price behavior of the underlying.
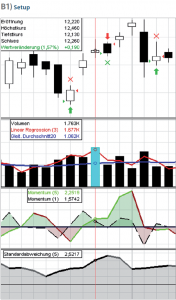
However, it is also possible to make somewhat shorter-term settings in Momentum and/or SDV or another analysis method of extremes in volume, for example via a separate indicator such as Accumulation/Distribution or the Money Flow Index. Figure 2 shows the trading signals of the output setup with a modification of the SDV with an extreme value of 0.5 - all other criteria remain the same. Between 2009 and mid-2010, the S&P 500 incurred eleven losses on 26 signals - but these are mostly relatively small. The market seems to be capped at the time of the signals. On average, the setup achieved a gain of 0.4 percent per trade in the period under review - a respectable figure given the short holding period of only one trading day.
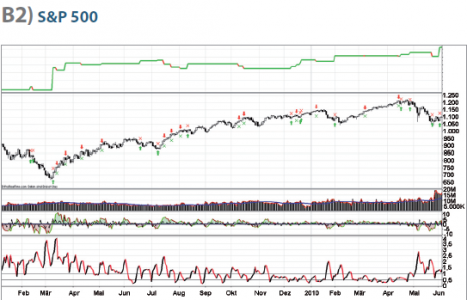
Image 2: S&P 500 between January 2009 and June 2010: The ratio between long and short signals is balanced with a standard deviation of 0.5. The news situation is generally responsible for high activity. If nothing "unusual" happens, accumulation occurs at below-average volume, an upward trend with relatively low volatility and small candle bodies unfolded from mid-February to mid-April. With bad news clearly more market participants see themselves induced to reconsider their positions and to trade. This is where the more profitable signals tend to emerge. Also note the standard deviation: Large candle bodies are accompanied by high values in the SDV. Since trading signals can only arise in a more or less volatile market environment, the extreme value in the SDV should adjust to the underlying.
Duration
A signal has been generated, the entry has taken place and a profit is booked shortly before the close of trading. Should the position now be held overnight and also over the following price units? After all, this would be in line with a possible intention such as "let profits run". The candlestick technique would also support holding the position in most cases. Nevertheless, take another look at Figure 2. Only a few of the triggered signals would, for example, show a profit or increase it over a holding period of 1 + X > 0 trading days on day 2 and beyond or in other words, over a holding period of 1 + X > 0 trading days. Obviously, many traders use the trading day following the consolidation in order to be able to enter or exit "cheaply". This is because the price will usually rise on this day after a successful short signal or fall after a successful long signal. Depending on the underlying security, this is the case in around 55 to 65 percent of cases. Also because the setup basically works better in shaky and rapidly fluctuating markets than in trendy underlying stocks, the entry and exit should be combined with a very short holding period.
Stops?
Of course, an initial risk stop can also be placed. In my opinion, however, this resembles hoisting a white flag - without knowing exactly why. In exceptional cases, such as an extremely rarely prevailing volatility towards one's own position or a position that is inadvertently too large, this technique may be appropriate as an emergency brake to contain losses. The stop and the associated loss potential should be derived from the chart technique and the intended holding period of a position. With this approach, profit taking or loss limitation is based on one price unit. Apart from that, with a short holding period of one price unit, a possible loss is easily calculable.
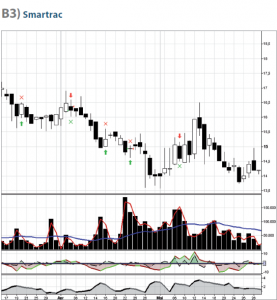
Image 3: Smartrac from the TecDAX between mid-March and the end of May 2010: The setup reacts very well to the volatile price behavior and the indicators. In addition to the chart technique, fundamental indicators such as the P/E can be a tool for valuing share prices. In this example, the share price and the 2009 P/E are in a medium-term downward trend after the publication of the annual figures. If the share price is divided by the index price, the result is a continuous ratio for determining relative strength relative to a reference (in this case the TecDAX).
One step further
Perhaps the use of a purely technical trading strategy is not enough for you. The strong competition, a changing market structure or the pursuit of a completely individual trading approach are good reasons to improve existing techniques by adding valid and consistent indicators or criteria. Of course, there are also numerous possibilities for this setup. One of these is shown in Figure 3, which shows the Smartrac share with a dynamic price/earnings ratio (P/E) and a strength index versus the TecDAX. The company published its 2009 figures on March 15, 2010. Although the interpretation of the P/E ratio is quite arbitrary, for example because there are no conclusions about a company's growth, the P/E ratio is a purely statistical figure and depends on the company's balance sheet policy, it allows a quick and independent comparison between industries or individual companies. In our example, in a largely positive market environment, the Smartrac share continuously lost value in price and P/E in the weeks that followed until the end of April. How strong or weak a share is in relation to the market as a whole can be illustrated by the following simple formula:
Closing price share / Closing price index
For better graphical scaling, this value can then be multiplied by 100, 1000 or 10 000. To evaluate relative strength or weakness, you can use a Moving Average or an average based on the previous n-data. The two indicators described above provide a good overview of the health status of a stock and can also be used as a filtering device, for example for a preferred short versus stocks with a P/E ratio > 30 and short-term relative weakness versus the benchmark index.
Conclusion
Volume indicators are very well suited to complement technically oriented trading strategies. Systems that act on the basis of trend and momentum can be further refined and diversified by analysis of the turnover. Regular deviations from the volume norm can lead to increased volatility and price deviations. Capital can be raised from these relative extremes. An additional evaluation of fundamental key figures or sentiment indicators can be incorporated into an analysis for the selection of trades and can usefully supplement strategies. As long as you feel comfortable with the number of indicators used and avoid the danger of over-layering (use of indicators with similar calculations and information), there is nothing to prevent the inclusion of supplementary analytical instruments. You are welcome to use the indicators presented here as suggestions.

About the author: Mathias Kufner, born 1984, has been trading stocks and commodities on short-term time levels for several years. His trading strategies are primarily based on sentiment and technical analysis. Contact: mathias.kufner@trading-and-research.de