Article 2 - If you decide to use indicators, it is important to gain insight into the behaviour of these indicators. You should familiarise yourself with the advantages and disadvantages of a particular indicator. For example, how do they behave in trend and sideways markets? What is the hit rate and risk/return ratio? Will I trade on the basis of daily or weekly prices or intraday? These are all questions that are important when selecting a particular indicator in a particular market.
The advantages of backtesting and optimization:
- Backtesting helps to evaluate a strategy based on historical data.
- Past performance provides conclusions for future assessment.
- With this information, parameters of the strategy can be optimized.
When selecting a particular indicator, the question arises whether the standard parameters are sufficient or whether they need to be adjusted (optimized). A representative backtest on historical prices should be used to analyse how an indicator has developed in the past. And to what extent adjusting the parameters improves the results. This backtesting and the optimization of indicators are possibilities that are available in almost all modern software packages for technical analysis. But it is a risky business to act blindly based on past results. The results in a real trading situation usually tend to be worse than in the backtest. Therefore it is advisable for every active investor to have basic knowledge of the application of indicators and trading systems. Therefore, basics are discussed without claiming completeness. Reference should be made here to the specialist literature.

Backtesting
Indicator backtesting is the process by which objective trading rules for buying and selling and past prices are used to calculate what would be generated by this strategy over a period of time. This of course also depends on the instrument used to implement a strategy (stocks, options, futures, etc.). As already mentioned, the actual trade will never deliver exactly the same results as the theoretical values from the backtest. It is important to examine the results more closely in order to determine whether they form a basis for future trading. In addition to a positive profit forecast, the results must of course also be measured against a number of other criteria. The most important are:
- Sufficient trades to be statistically significant.
- Maximum loss per trade (drawdown).
- "Hit rate" (number of winning trades/total number of trades).
- Average profit/average loss.
- Benchmark for return and risk (WS index and Rina index).
These criteria are examined in more detail under Return and Risk. In addition, psychological factors also play a role in the assessment of a backtest. Although a strategy may look statistically good, it is difficult to maintain it if many consecutive loss-making trades take place regularly. Two, three or four consecutive losses are still manageable. But after a series of ten losses, even the most experienced trader will start to worry. While statistically nothing has happened yet, morale is so impaired that most people prefer to throw in the towel.
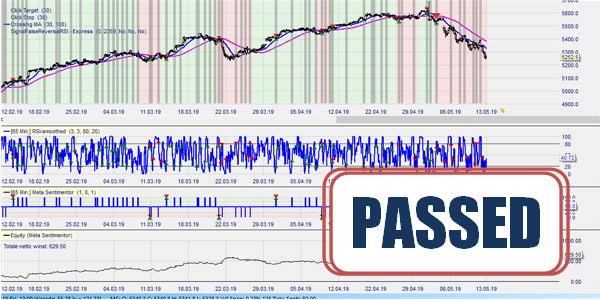
This example shows a statistical backtesting result over a four week data history using the MACD indicator in the NanoTrader trading platform.
Backtesting is a review of the past with knowledge about the future. This makes it possible to deduce what would have been achieved. Frequent pitfalls when performing a backtest are:
- Trading on the basis of the closing prices of a bar in which the signal is given.
If an indicator trades e.g. on daily closing prices, then it is only 100% certain at the moment when the signal can no longer be traded. It is therefore not realistic to carry out a backtest with these closing prices. A backtest at the opening price of the next day would give a more reliable picture.
- Execution of the order at a price other than that specified by the indicator.
If an indicator has specified a certain limited order, the question arises as to whether this limit price can also be traded. Price formation is not a continuous process, but takes place in small or large steps. A stop-loss sell order in a market without counterparties results in a significantly lower price than in a theoretical backtest. This so-called slippage will never be exactly accessible in a backtest, but a certain percentage can be calculated.
- Transaction costs
Transaction costs can have a significant negative impact on earnings. Especially if many trades are executed. Always make a realistic assumption in a backtest.

"The NanoTrader platform is magnificent." – Kai
"NanoTrader is my fourth trading platform and it is by far the BEST platform." – Henry
"I have already familiarized myself a little bit with the platform and I can tell you, that it is the best trading platform I have ever used." – Peter
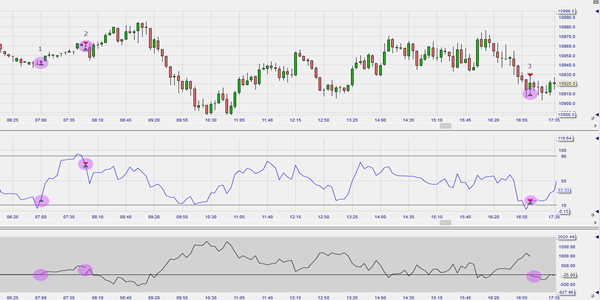
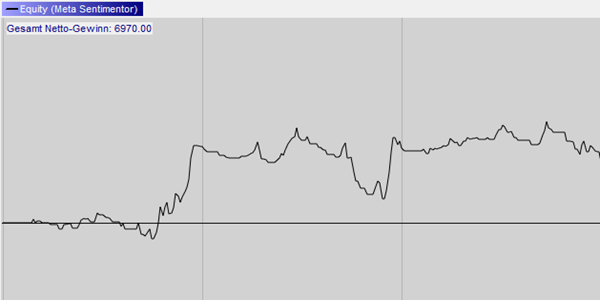
This example shows an RSI indicator with three profitable trades (two long (1.3) and one short (2)) in the NanoTrader trading platform. The arrows indicate the points of sale and the points of purchase. The lower area shows the so-called asset curve. This area shows the performance of the capital (cash plus open position). With a successful trading system, this line will show an ascending trend.
Optimisation
If an indicator or trading system with the standard parameters does not make sufficient profit or loss in a backtest, it is tempting to adjust the parameters so that they would have made money in the past. However, this so-called optimization is not uncontroversial within technical analysis. Opponents say that if a system does not work with historical data, it makes little sense to optimize it until it finally generates profits. This past does not return in the same way and the whole thing ends in the infamous effect of (curve) over-optimization. Leaving the default settings causes the indicator to have problems giving good signals in the future. The ability to generalize is taken from the system, according to the critics. The proponents of optimization, on the other hand, believe that (curve) overfitting can be avoided if optimization is performed correctly. They stress that the parameters found must be robust. This means that the application of a large number of related parameters is necessary to achieve maximum gains. A robust trading system is expected to remain profitable longer in a changing market. Let us leave the discussion between proponents and opponents here.
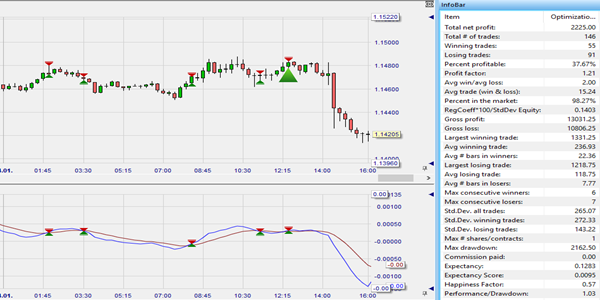
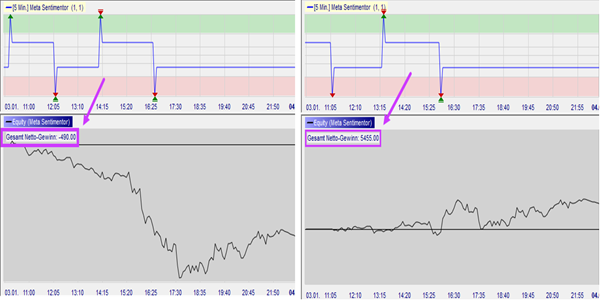
This example shows an over-optimization of a Crossing Moving Average based on a 5 minute chart in the NanoTrader trading platform.
It is interesting to see how an indicator behaves during optimization. One technique to gain more insight into the optimization process is to present the results in a so-called optimization curve. An optimization curve shows the parameters on the X-axis. The Y-axis shows the corresponding average profit/all trades (total profit divided by the total number of trades). A healthy optimization curve shows wide areas with a wide range of profitable parameters. Immediately adjacent parameters that show both profit and loss - so-called spikes - should be treated with skepticism.
When applying optimization in practice, it should always be noted that optimization does not guarantee future success. If the found optimum is extremely far away from the standard parameters, special caution is required. Ask yourself what makes this market so special and what the chances are that it will stay that way. Make sure that the market in the optimisation period has the same character as the market in which you will trade, for example trend trading or sideways trading.
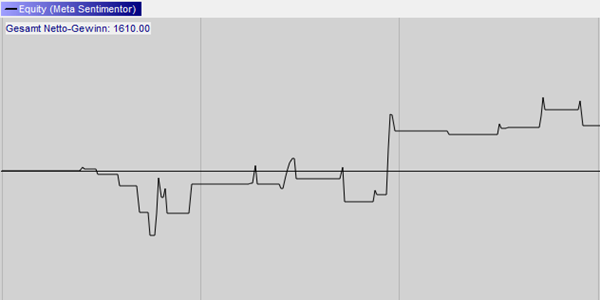
Two examples of optimization curves
Optimization curves of indicators with several parameters can be created differently, depending on the order of the optimized parameters. In these cases, the shape of the curve depends on the software used.
Optimization curve with spikes This optimization of a trend following indicator for a trading market shows a few profitable parameter spikes. These parameters do not provide a robust system.
Optimization curve of the flat tops The optimization of a trend following indicator on a trend market shows wide ranges with profitable parameters and can form the basis for a robust system.
This example shows an optimization curve with spikes in the NanoTrader trading platform.
This example shows an optimization curve with flat tops in the NanoTrader trading platform.