The beta is designed to indicate a stock’s risk in relation to an index. It is common to calculate beta on the basis of monthly prices over a period of 60 months (five years), but it is also possible to calculate beta over other prices and periods. Beta shows relative volatility (systematic risk), with 1 being by definition the volatility of the relevant index (for example, the AEX Index). A beta larger than 1 means that the stock is more volatile than the index, and a beta smaller than 1 suggests lower volatility. Because beta is relative, it indicates how much greater or lesser the risk is of a given stock. For instance, a beta of 1.15 signals that the stock is 15% more risky than the index. By the same measure, a beta of 0.7 points to the stock being 30% less risky than the index. Theoretically speaking, negative beta is also possible: this means the stock is moving in the opposite direction to the index.
Correlation
In addition to beta, correlation can also be calculated. The correlation can vary between 0 and 1, and is a measure of the relationship between the index and the stock. In practice it indicates the reliability of the beta. If the correlation is low, the reliability of the beta is limited, but with a high correlation the stock’s movements reflect those of the index.
Alpha
Alpha signifies the extra return that is realized versus the index. Alpha is the outperformance that a stock generates above what could be expected based on the beta. A positive alpha indicates that a stock is outperforming relative to what its beta would suggest. Equally, a negative alpha signifies that a stock is underperforming, given the expectations generated by the stock’s beta.
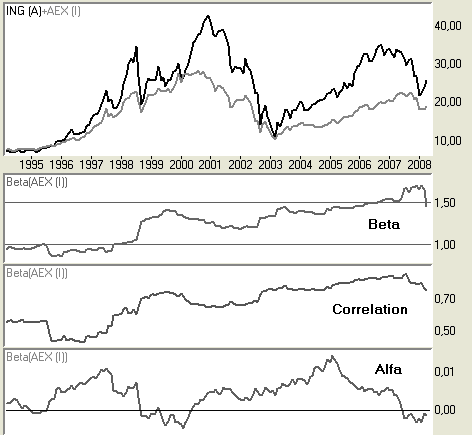
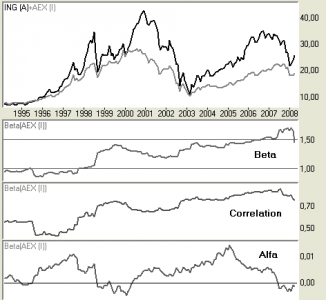
The following example shows the Beta between the Dutch stock ING and the index AEX
Click here to get a free demo account.