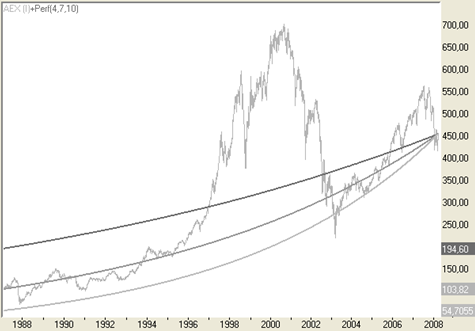
Performance lines indicate the development of a fixed-income security that has the same value at maturity as the chart. Yield is calculated as compound daily interest. In a linear chart, this produces a curved line, but the line is straight in a logarithmic chart.
This tool demonstrates to what degree a stock or other security deviates from the desired yield line, and this says something about the risk involved in realizing a given return.

