
A stock’s Relative Strength (RS) line reflects price movements relative to a second stock or index.
Click here to see Relative Strength representations inside a real time trading platform.
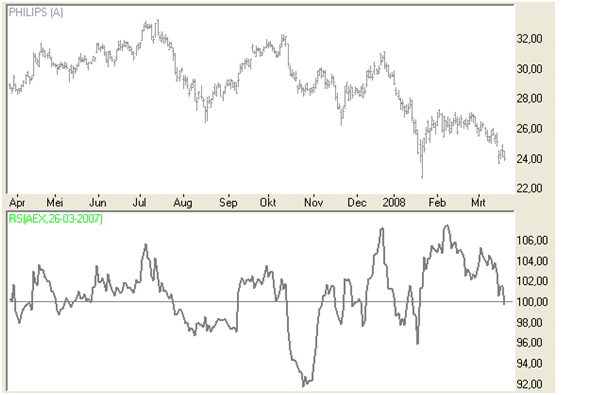
A frequently used method is to display a second stock as a horizontal line (100%). The first stock then oscillates around this line. A rising line indicates that stock 1 is strengthening relative to stock 2, and a falling line that it is weakening.
The RS is often used in momentum strategies. For example, to select index participants that are the strongest – or weakest at that moment in time.
Another option is to superimpose two or more stocks or other securities on the same scale and to normalize the stocks with a correction factor (e.g. from the starting point). This provides an accurate picture of how multiple stocks are behaving relative to one another. The Relative Strength indicator should not be confused with the Relative Strength Index (RSI). They are not related to each other.
Apply here for a free NanoTrader demo.
PARAMETERS
- Relative strength versus other stocks and securities
- Period over which RS is calculated
BUY AND SELL SIGNALS
N/a
DIVERGENCE
N/a
INDICATOR TYPE
Trend following
This example shows the relative strength of Philips compared to the AEX index (100% line), calculated over 1 year.
Are you looking for an outstanding futures and CFD-Forex broker?

In the annual Brokerwahl traders voted WH SelfInvest as "Nr. 1 Futures Broker" and "Nr. 2 CFD Broker". For an incredible five times in six years WH SelfInvest is considered the best futures broker, beating all competitors by a wide margin. In CFDs WHSelfInvest came only 0,1 behind this year's first-placed broker. Clients are extremely satisfied with the low commissions, outstanding order execution and the legendary service.