The ROCEMA indicator is a combination of an Exponential Moving Average (EMA) for which a Rate-Of-Change (ROC) is calculated.
Click here to see a ROCEMA inside a real time trading platform.
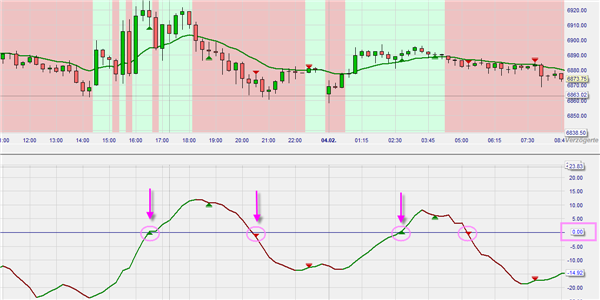
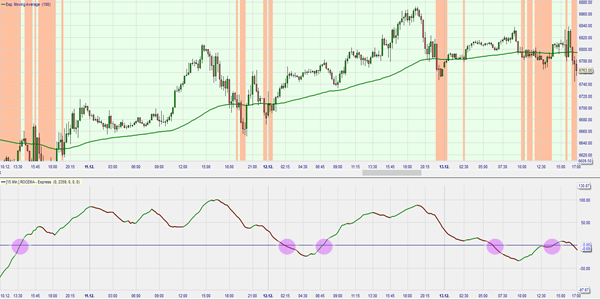
This combination was promoted in the Netherlands by Pierre Dolmans, who mainly used this combination with 15-minute prices to trade in futures. Take closing prices and straighten them out with the Exponential Moving Average (EMA). Then calculate the Rate-of-Change (ROC) of that EMA. A positive ROC suggests a rising trend, and we go long. If the ROC is negative, the trend is falling and we go short. The crossings of the ROC with the ‘zero line’ constitute buy-sell signals. The indicator behaves like a trend-following indicator, but use of ROC means it really belongs among the oscillators. The indicator is easily optimized for many markets, something to which it owes its popularity.
Over the years, Frans Schreiber’s publications have described many variants of this indicator with all sorts of additions: trend filters, stop-loss rules and take-profit rules.

PARAMETERS
- EMA (15)
- ROC (60)
BUY AND SELL SIGNALS
The crossings of the ROC with the ‘zero line’ constitute buy-sell signals.
DIVERGENCE
N/a
INDICATOR TYPE
Trend-following
This example shows a ROCEMA based on a 15 minute EMA in the NanoTrader trading platform. The buy and sell signals are clearly visible when the zero line crosses up and down. In addition, the Rocema was inserted as a filter so that the buy and sell zones are highlighted in color in the main chart.