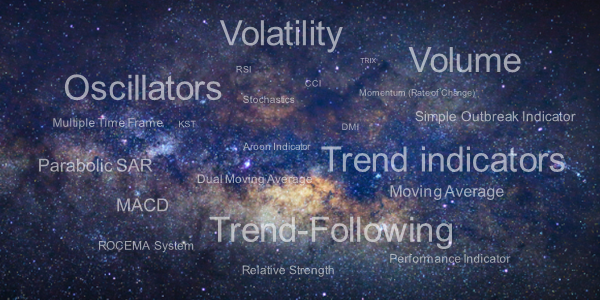
If you are just beginning with technical analysis, then you will be asking yourself which indicator to use. The two key groups of indicators are the oscillators and the trend-following indicators. The trend-following indicators are mostly used in trending markets. One key feature is that they lag the market. Oscillators – which are mainly used in trading markets – are less susceptible to lagging and are also known as leading indicators. The advantage of oscillators is that they are good at timing short runs in a trading range, but are not so good at providing good signals in longer-lasting trends. Furthermore, they can get dangerous when they fail to give any sell signal at all and losses start to mount. You should therefore always use stop-loss orders with oscillators, or at least some other kind of protection against false signals. Trend-following indicators usually protect you from rapidly rising losses.
Beginners would do well to first examine a moving average. How do the signals behave, and which trends are well-timed and which aren’t? The RSI is a good start for oscillators. Try this indicator sometime with parameters 2, 8 and 14 days, for instance. Which trades in a price range are well-timed and when do things go wrong?
The ideal indicator or ideal system does not exist. Every indicator has its pros and cons, but the better you understand an indicator, the more confidence you will have once you start using it.
The advantages of the indicator:
- Trend-following indicators: Indicators, especially for the timing of trades in trend markets.
- Oscillators: Indicators commonly used in sideways markets.
- Trend indicators: Indicators for gauging whether a market is trending or trading
- Volume indicators: Indicators where volume data also plays a role.
- Seasonalities: Indicators that apply seasonal effects.
- Volatility indicators: Indicators that apply and analyse volatility.
Are you looking for an outstanding futures and CFD-Forex broker?

In the annual Brokerwahl traders voted WH SelfInvest as "Nr. 1 Futures Broker" and "Nr. 2 CFD Broker". For an incredible five times in six years WH SelfInvest is considered the best futures broker, beating all competitors by a wide margin. In CFDs WHSelfInvest came only 0,1 behind this year's first-placed broker. Clients are extremely satisfied with the low commissions, outstanding order execution and the legendary service.
Test WH SelfInvest, download a free demo.
Trend-following indicators
Trend-following indicators are designed to be used in trending markets. One key feature is that they lag the market. Trend-following systems are often characterized by relatively low hit rates (± 35–50%), together with high average profit / average loss (P/L) values (± 2–4). Profits are obtained in a relatively small number of lucrative trades. The disadvantage of relatively low hit rates is that it means a higher frequency of losing streaks. Not only that, but indicator lag can also cause profitable positions to evaporate within a single trade. These disadvantages can be very frustrating for a trader. Trend-following traders therefore require a healthy dose of perseverance. One more feature of trend-following indicators is that they always lag the trend. It would of course be great if a signal could be given precisely when the price trend falters or reverses, but indicators require a range of price data to determine whether a trend is turning. This lag applies to all trend-following indicators to one degree or another. The counterpart to trend-following indicators is oscillators.These generally have a higher hit rate and react faster, especially in a trading market. Profits are harvested in small portions, usually in a relative large number of trades.
The trend-following indicators include:
- Moving Average
- Dual Moving Average
- MACD
- DMI
- Parabolic SAR
- Moving Stop Loss (MSL)
- ROCEMA
- Performance Indicator
- Aroon Indicator
- Relative Strength
- KST
- Multiple Time Frame
- Simple Outbreak Indicator
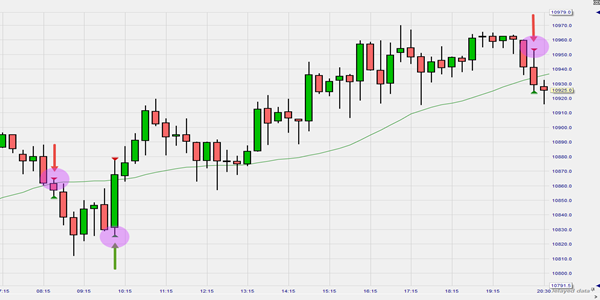
This example shows a 15-minute moving average chart in the NanoTrader trading platform. Closing of the candle below the Moving Average generates a sell signal (red triangle), closing of the candle above the Moving Average generates a buy signal (green triangle).

Oscillators
In mathematical terms, oscillation means: ‘swinging back and forth around a constant value’. Oscillators are a group of indicators with a constant value of usually 0, 50 or 100. If an oscillator reaches a high value, then this generally means that the current price has deviated far from its zero line and that the stock is overbought. If the oscillator reaches a low value, then we refer to an oversold situation. In both cases technical recovery will follow. Oscillators are often thought to perform best in sideways trading markets. Exceptions include ROC, TRIX and CCI, which in practice also appear to behave like trend-following indicators.
Oscillators are often characterized by relatively high hit rates (between 60–70%), together with low average profit / average loss (P/L) values (often < 1). Total return is generated in a relatively large number of trades with relatively small profits.
Oscillators are often very critical in terms of parameter settings, with optimum values often differing substantially between individual securities. Bear in mind my remarks on Optimization in chapter 2.4. One danger of trading with oscillators is that they often lack built-in protection against false signals. Therefore, always apply a stop-loss system when using this type of indicator.
The oscillators include:
- RSI
- Stochastics
- Momentum or Rate of Change (ROC)
- CCI
- TRIX
- Williams %R
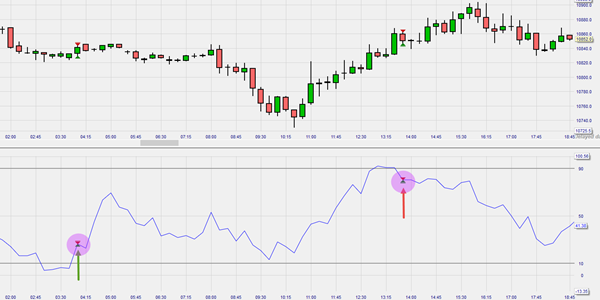
This example shows the oscillator RSI with equilibrium value 50 in the NanoTrader trading platform based on a 15-minute chart. The thresholds are 90 and 10 and serve as a trigger line. The return of the price above these limits in the direction of the equilibrium value generates a short signal (red triangle) or a long signal (green triangle).
Trend indicators
Trend indicators (not to be confused with trend-following indicators) are a tool to distinguish whether a market is in a trend or sideways phase. Theoretically, if a trend indicator has a high value, a trend following indicator should be used and if the trend indicator has a low value, an oscillator should be used. This is a useful method in itself, but often beautiful trend trades are missed because the trend indicator is still at a low level when an entry signal is generated.
In addition to the absolute value of a trend indicator, its direction should also be considered. A rising trend indicator indicates an upward trend, a falling trend a downward trend. A very high value often indicates an overheated market and can be the sign of a trend reversal (up or down).
The problem is that, like most indicators, trend indicators are lagging, i.e. acting behind price developments. The three indicators listed below each have different characteristics in this respect. ADX, VHF and RAVI are selected because they each measure the trend according to a different principle.
This example shows a strong trend phase with an ADX value greater than 20 based on a 15-minute chart.
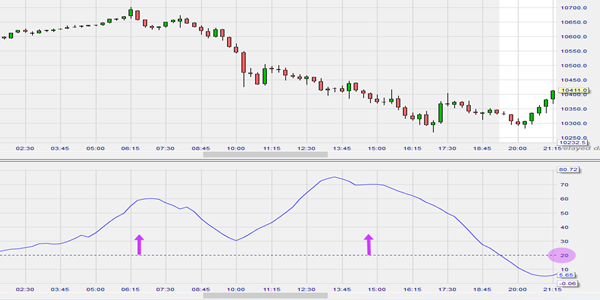
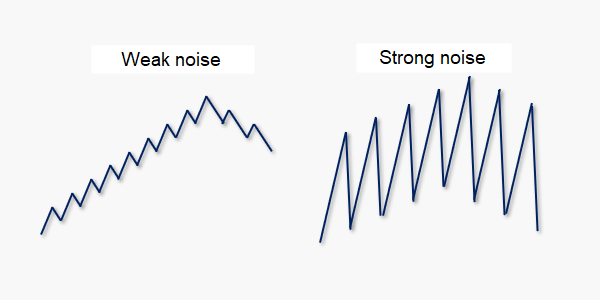
Trends and the concept of noise
The trend is sometimes less clear due to strong short time price movements or so-called "noise". The more volatile the market, the more noise. Although the concepts of noise and volatility differ from each other, it is often the case that high volatility is accompanied by a lot of noise in the market and therefore the trend is more difficult to determine. The VHF calculation is the only one of the three trend indicators that has a built-in correction for the degree of noise.
Trend following indicators (e.g. Moving Average and DMI) generally perform best in trend markets with low noise.
This example illustrates the noise of the market.

The trend indicators include:
- ADX
- RAVI
- VHF
Volume indicators
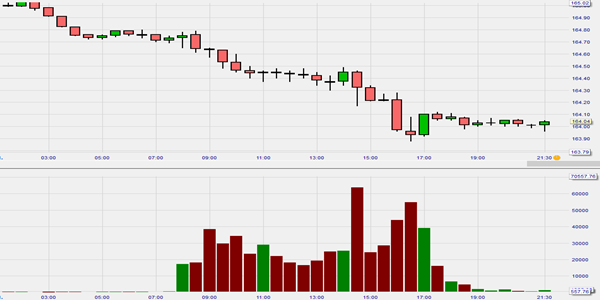
Volumes are an important quantity in technical analysis. They indicate investor and trader activity. Volumes are often shown as a histogram under the price chart, sometimes supplemented with a moving average. In their calculations, volume indicators combine volume with price data. It is this combination that gives volume indicators an extra dimension relative to other indicators.
This example shows the volume indicator in the form of a histogram inside NanoTrader.
The volume indicators include:
- Money Flow
- On Balance Volume
Seasonals
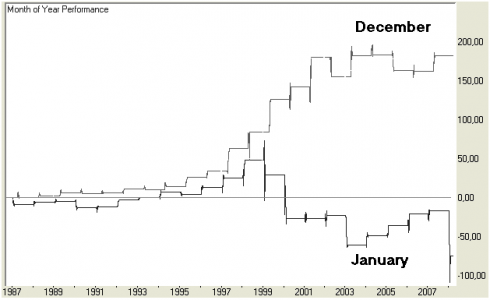
Seasonals is the general term for indicators measuring seasonal effects in the prices of commodities, equities and indices. It is not difficult to appreciate the seasonal effects on the prices of grain, wheat or other agricultural products, for example. However, this phenomenon also affects other stocks and indices. The market maxim Sell in May and go away, but remember to be back in September is one of the best-known examples of a seasonal effect. Research carried out in 1999 by university lecturer Ben Jacobsen together with Sven Bouman suggests that the prices usually fall from May onwards, but score above average from October/November onwards. Psychologists and economists have been trying to explain this for years. Something that has generated both interesting and amusing theories. Some claim, for instance, that there is a correlation between equity markets and the sun, the temperature and the lunar cycle. Recently vacation periods and winter depression have been blamed for seasonal price fluctuations. But a conclusive explanation has yet to be discovered. The effect is found in all western indices to some degree or another, but also occurs in the Japanese Nikkei Index. However, the periods are slightly different in scope and duration for each country or region in which it occurs.
An example of a seasonality in the AEX index is the occurrence of good and bad calendar months. The figure shows the result if you are only invested in the AEX index for 2 calendar months: December and January (1987 - 2008).
The effect can even be observed at day level. Certain days of the week consistently seem to be better days to invest than other days. We don't actually talk about seasonal effects anymore, but about so-called anomalies. An anomaly is an empirical irregularity that can be used to beat the market. In addition to the daily effect, numerous other anomalies have been "discovered".
Volatility indicators
Volatility is a measure of how much a stock or security fluctuates. Volatility plays a key role in options trading when calculating options prices. But it is also used in the calculations of indicators. Volatility also measure the risk level of individual securities. The higher the volatility, the higher the perceived risk. This means that as volatility increases, the options premium will increase accordingly. In other words, the premium paid to insure against a price decline using a put option will also be high.
Below you will see how volatility works if you wish to protect your portfolio with put options. The position is opened with a strike price set at 10% (out-of-the-money) below the portfolio value. In the table, the strike price is equal to the portfolio value (at-the-money).
The tables below assumes 30-day volatility.Roughly speaking, we can say that volatility (30) has a value of:
- 20 = quiet market, normal
- 30 = turbulent and volatile market, tense
- 40 = hectic market, roller coaster
Table 1: Premium put option 10% out-of-the-money
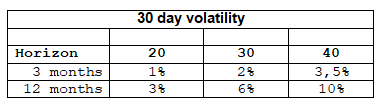
Table 2: Premium put option at-the-money
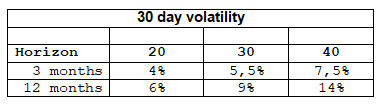
Example: You want to protect an AEX-Tracker position from a price drop of more than 10% in the next 12 months (the first 10% drop is uninsured). The market is quiet, the volatility over 30 days is about 20. Table 1 shows that you lose 3% of the position value if out-of-the-money put options are used for hedging.
For full protection, you need an at-the-money put option (Table 2). The costs then rise by around 3%. This is only a rough approximation. With a special option software this can be calculated exactly.
Standard deviation:
Another term we discuss in this chapter is standard deviation. The standard deviation can be understood as the average deviation from the average. When we visualize the standard deviation (STDEV) of closing prices, the form is very similar to volatility. The volatility value is comparable for different instruments, while the STDEV is unique for each instrument and therefore not comparable. For traders, however, STDEV has the advantage that the value is directly related to the current price. It can be used to determine a higher or lower stop loss depending on the risk. A concept that strictly speaking does not belong in this chapter is the Average True Range (ATR). In trading practice, however, the ATR shows significant similarities with the standard deviation. The ATR is also a kind of measure of the volatility, which is even more obvious to a trader in terms of calculation and character.
