
The Average True Range (ATR) is an indicator based on price differences between two trading days and is regarded as a seismograph of volatility. We will show you how to use the ATR for the setting of
stops and the creation of positions.
The extent of market movements, also known as volatility, is constantly changing. Sometimes the prices fluctuate particularly strongly, sometimes hardly. This has a significant impact on trading. For example, if traders set their stop too tight in a volatile value, they could be stopped by random movements alone. If they set it too far away, this could lead to the
in the worst-case scenario. The Average True Range offers a good measure for setting the loss limit or determining the position size. This allows you to adapt automatically to the market environment.
ATR
Average True Range is an indicator of volatility, i.e. the fluctuation range of a market. The range is the range between high and low on a trading day. For example, if the DAX opens at 11500 points, then rises to 11550 in the high and finally falls to 11490, then rises again and closes at 11535, then the spread is 60 points - the difference between high and low (11550 - 11490). The opening and closing prices do not play a role in the range.
At an ATR of 60 points, we are in a quiet market phase. If the markets are moving properly, this value may well reach the 300 mark.
In order to determine the Average True Range (ATR), it is crucial that market opinion is not formed exclusively during official trading hours. On the contrary, this process takes place when the stock markets have closed. This is expressed in the opening price, which often results in price gaps. For example, if the DAX closed yesterday at 11500 points and opened today at 11535, the stock market obviously tended positive overnight. Market participants are collectively prepared to pay more for the index than at the end of the previous day.
With the True Range, this price change is included overnight. In a second step, the Average True Range can be calculated as an average. In the default setting, this takes place over a period of 14 trading days.
Calculation
In concrete terms, the True Range is the largest of three values: the distance from today's high to today's low, the distance from yesterday's close to today's high, and the distance from yesterday's close to today's low.
The three variants can be seen in Image 1. The letter D describes the largest of the three ranges. With D1, the daily span is sufficient for the span of the previous day and is in this case larger than the other two values of the ATR calculation. Therefore, the true range at D1 corresponds to the daily span. For D2 and D3, gaps have arisen that are taken into account when calculating the true range. For D2, the distance between the closing price of the previous day and the high of the current day is the largest of the three values; for D3, the distance between the closing price of the previous day and the low of the current day.
During the smoothing period, the ATR develops over time. Figure 2 shows such an indicator curve for the DAX chart. The scale on the right in the lower chart section shows the ATR values in points. It is easy to see how much the ATR can vary. The ATR increases especially in the case of strong price drops as in January 2016, while it typically falls in the case of longer upward movements (from February 2016). This is due to the fact that especially the large downward movements usually run much faster than comparable upward movements.
Image 1: Calculation of the True Range
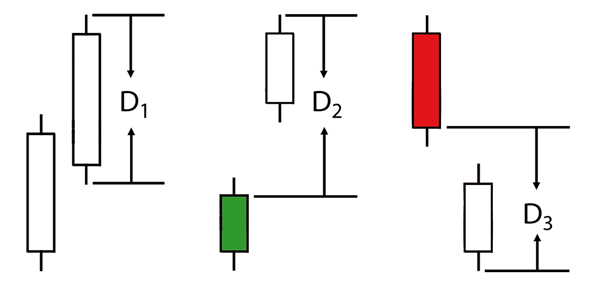
Image 2 shows the DAX and the ATR (sub-chart). It is easy to see that strong downward movements, such as in January 2016, are accompanied by correspondingly high values for the ATR. In upswing phases, the ATR usually drops significantly.

Position sizing
How can ATR be used for trading? First of all, it is a good tool to objectively assess the risks and opportunities of a trading instrument. The higher the ATR in the past, the higher the likelihood of greater price movements in the future. Since a range as such always has a positive value, the ATR always assumes values greater than zero, regardless of whether it went up or down. If there are only very small fluctuations, the value is close to zero.
Many traders determine their position size on the basis of the stop level at which the trade is closed out in the event of a loss. A risk is defined for each trade, which should not make up more than two percent of the portfolio if possible. The next step is to determine the price at which the trader wants to enter the market and the price at which he sets the stop loss. The amount at risk is then divided by the difference between the entry and stop loss. The resulting number of shares results in the optimum position size for the respective trade:
- Number of shares = risk per position / (entry price - stop price)
Broker WH SelfInvest receives another outstanding rating from the German consumer institute.

- Order execution: 5 out of 5 stars. Score: "extremely good".
- Trading platform: 5 out of 5 stars. Score: "extremely good".
- Mobile platforms: 5 out of 5 stars. Score: "extremely good".
- Service quality: 5 out of 5 stars. Score: "extremely good".
- Order possibilities: 5 out of 5 stars. Score: "extremely good".
Test WH SelfInvest: free demo trading account.
Position size determination using ATR
But the ATR could also be used to determine the position size. Instead of the percentage rule, there is also the option of taking into account the current market volatility, i.e. the general risk. In principle, the ATR value is used, which is calculated at the time level of the actual trade. For example, if a trader trades on signals on the 1-hour chart, the ATR of the price bar is the reference to the stop. In addition, each underlying has its characteristic ATR values to consider. We now set our stop on the basis of the prevailing volatility. The double ATR is suitable for this as an initial stop. Let's take a look at an example:
- Capital: 10,000 euros
- Risk per position: 2 percent
- Absolute risk: 200 Euro
- Entry level: 100 Euro
- ATR: 3 Euro
- Risk per share: 6 Euro (2 x ATR)
- Number of shares = 200 Euro / (100 Euro - 94 Euro) = 33 Optimum position size: 33 shares
The longer the investment horizon, the higher the volatility and thus the risk (Fig. 3). Therefore, you should adjust your risk and money management to the volatility.
Image 3: Risk increases with the investment horizon
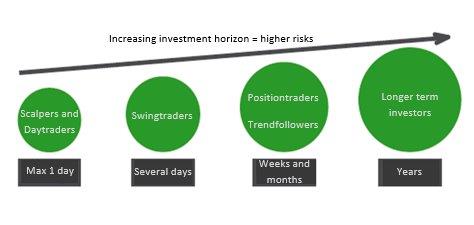
Image 3 shows how risk increases as the investment horizon becomes longer. The reason for this is rising volatility. In order not to be constantly unintentionally stopped out, the volatility must be compensated by further stops.
Conclusion
In principle, the stop should not be too close to the current price, otherwise traders can be stopped by chance. At the same time, the stop should not be too far away, otherwise the potential of the trade is not attractive. The ATR provides a tool for traders to place stops as sensibly as possible based on the current volatility. However, the ATR is not a guarantee for profits.
