In order to consider a "fake" trend reversal, the following criteria must be met:
- the market is in a prolonged trend.
- the market reverses trend.
- this trend reversal is not strong.
- the market moves sideways for a moment.
- the market turns back in the direction of the initial trend.
To obtain a trading signal, two technical analysis indicators have been combined: a crossing moving average and the smoothed Relative Strength Index indicator. The RSI is an oscillator which indicates if a market is overbought or oversold.
The signals are subjected to a filter. The filter is based on a crossing moving average. The filter rejects any signal which is not in the direction of the main trend. The filter colors the chart background green if the trend is bullish and red if the trend is bearish.
Tip: if you want to open a position based on a fake trend reversal signal, check the chart to see if there is a clear prolonged trend before the fake reversal occurs. Just like in the examples below.
A buy signal appears when the filter indicates a bullish trend (green chart background) and the RSI climbs back above 20. A short sell signal appears when the filter indicates a bearish trend (red chart background) and the RSI drops back below 80.
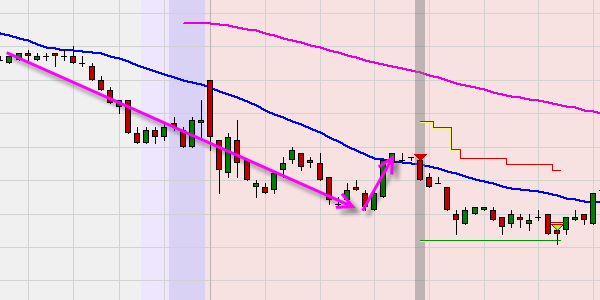
This example in a 10-minute chart, shows a bearish trend followed by a fake reversal. If the reversal slows down and starts to move sideways, a short sell signal is given. The target is reached and the position is closed with a profit.
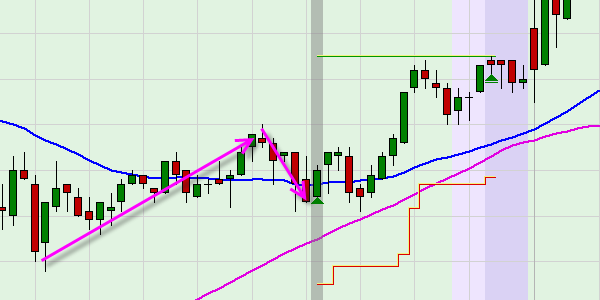
This example in a 10-minute chart, shows a bullish trend followed by a fake reversal. If the reversal slows down and starts to move sideways, a buy signal is given. The target is reached and the position is closed with a profit.