The shoulder-head-shoulder formation (SHS for short) is one of the best known formations at all and can be found in almost every beginner's work for technical analysis. We show you the logic behind it and how you can use the SHS in your trading.
Besides triangles and flags, the shoulder-head-shoulder formation belongs to the standard repertoire of formation theory. It bears its name because of its similarity to the human upper body. An SHS consists of two shoulders, a head and the neck line which connects the two shoulders. Such a formation usually occurs at the end of strong trends and can initiate a superior reversal. It is therefore considered to be a group of trend reversal formations.
Try our strategies on the award-winning NanoTrader platform.

"The NanoTrader platform is magnificent." – Kai
"NanoTrader is my fourth trading platform and it is by far the BEST platform." – Henry
"I have already familiarized myself a little bit with the platform and I can tell you, that it is the best trading platform I have ever used." – Peter
What's going on?
A stock is in an upward trend. After this has overheated, there is a first breather; the first shoulder is formed. After this phase of consolidation, however, the rally really begins. Prices are heading towards new highs, usually at an adventurous pace. The head is forming. Arriving at the summit, the movement suddenly seems to run out of petrol; it comes to a high. The courses suddenly tumble down and just as fast as they had risen before. Shortly above the starting point of the whole movement it goes up again, the prices rise one last time and now form the second shoulder. From then on it goes down.
What is behind it?
Shoulder-head-shoulder formations hold a special logic and can be traced back to early speculative bubbles such as the tulip crisis in Holland from 1634 to 1638 or the South Sea fraud in England from 1711. The same pattern occurs again and again when big dreams of fast money suddenly disappear into thin air. Figure 1 shows an SHS in the K+S share that developed between May and June 2009 and marked the end of the upward trend. The first shoulder to emerge is that of institutional, professional or experienced traders and investors. On the basis of well-founded market assessments, they assume that prices will rise and buy. This drives prices up. Over time, however, profit-taking sets in and the first shoulder emerges. The media are now full of reports of immense price gains. More and more private investors are now becoming aware of the fact that a lot of money can be earned on the stock market. Suddenly inexperienced small investors stream onto the market and begin to buy. The mania begins and it comes to a chain reaction: The faster the courses rise, the more humans become attentive to the phenomenon. However, insiders and experienced investors are now holding back on buying. They have been invested for a long time and can look forward to rising prices. But at some point they begin to liquidate their positions. As a result, prices fall. More and more institutional investors are throwing their shares onto the market, while the general public still cannot believe that the boom will be over. The head has emerged. Once the professionals have sold, there is room for a counter-movement. This is once again being done by small investors who have still not given up hope and are happy about "cheap entry prices". Now the second shoulder is being trained. However, there is no money for a further upward movement. The small investors are still invested, while the big ones remain liquid or have long since opened short positions. With the break of the neck line it goes finally into the cellar.
Picture 1: SHS formation at K+S
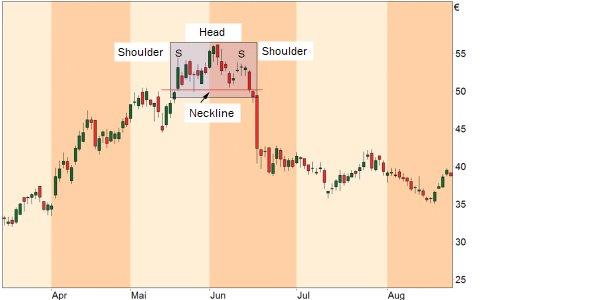
Picture 1: An SHS formation formed in the K+S daily chart between May and June 2009. Subsequently, the share fell - thus the upward trend was over.
Picture 2: Inverse SHS formation at AIXTRON
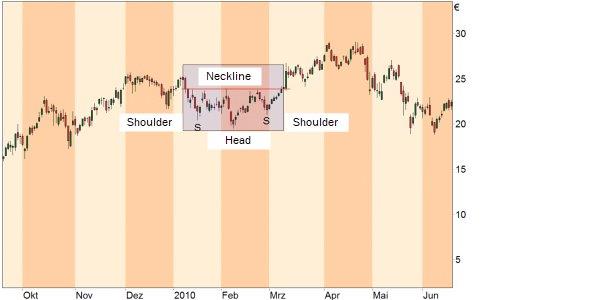
Picture 2: Between January and March 2010, an inverse SHS formation formed in AIXTRON's daily chart with a subsequent ideal-typical upward eruption.
What is an inverse SHS?
Of course, the same game can also take place in the opposite direction. In this case, an inverse SHS occurs in which the two shoulders lie above the head (Fig. 2). Here the pros start to dissolve their positions or to open short positions and after a while the mass jumps onto the train. But at the second shoulder the selling pressure is no longer enough and the pros go increasingly long at the end (i.e. when breaking out over the neck line). This ends the downward trend.
Do SHS formations say anything about course targets?
In the classical literature on SHS formations, it is usually said that the course goal is the distance between the head and neck line. Assuming the neck line of an SHS is at 60 Euro and the head at 80 Euro. The difference between these two values is now subtracted from the neck line. This would result in a price target of 40 euros. Such price target calculations should, however, be treated with caution. However, it can be generally said that usually with the break of the neck line with an SHS of further falling and with an inverse SHS of further rising prices it can be assumed.
Where's the problem?
The recognition of formations is usually a subjective process, the truth lies in the eye of the beholder. For example, it may happen that one analyst identifies the second shoulder of an SHS sooner or later than another. SHS formations cannot be translated into mathematical formulas - and that makes them unusable for trading systems. In addition, although SHS formations are always easily recognizable in hindsight, if the formation is still in its infancy, it can easily be misinterpreted. For example, where the second shoulder is suspected, prices could rise further and form a double top.
Conclusion
The value of an SHS lies above all in its warning character. Even if one can never be sure as a trader whether the structure actually develops in this way, this knowledge can be used to recognize possible warning signals at an early stage. The danger of accidentally falling into the herd instinct is reduced.
More than 100 indicators are available in the NanoTrader with one click as well as more than 60 ready-to-use strategies for direct use. You can test them immediately and free of charge.