
Elsewhere we discussed the Japanese candle chart technique, the main basic candles as well as the forecast horizon of the candlesticks. It became clear that this candlestick charting technique is neither an art nor a science, but rather a learnable skill based on the basic understanding of behavior patterns of the mass of active traders. Also relevant is the fact that the ambitious trader does not necessarily have to know all known candlestick patterns. It does not always make sense to have "broad knowledge", but rather to have a "deep understanding" of what mood patterns selected by the candlestick methodology represent and when these patterns are actually meaningful.
The evaluation of the expressiveness of a pattern can be supported by linking different time levels of the candlesticks and with the help of indicators or their defined "state ranges". Sophisticated statistical methods that investigate the significance of candlesticks, on the other hand, do not necessarily help. Because a meaningful application of candlesticks always depends on the current market environment - also including trend and formation analysis.
Meticulously precise definitions of the patterns, which in turn are indispensable for statistical evaluation, often leave meaningful but imperfect patterns as well as the connection with trend and formation analysis out of the equation and no longer appear in any statistical analysis. Candlesticks are therefore above all a discretionary matter.
This article presents the most important candle in candle charting: the hammer.
Definition of a hammer
The following definition of the hammer has become established in the literature and on the Internet: The hammer has a small upper candle body (black or white) without a wick (or with a very small wick, which should not be longer than the candle body) and a long fuse, which should be at least twice as long as the candle body of the hammer.
The closing price of the hammer is close to the lower range of a pronounced downward trend. After a downward trend, the hammer is a possible lower reversal point. If, on the basis of the closing price, the hammer passes its low point downwards, the downward trend is considered intact (Fig. 1).
Image1: Hammer to downward trend
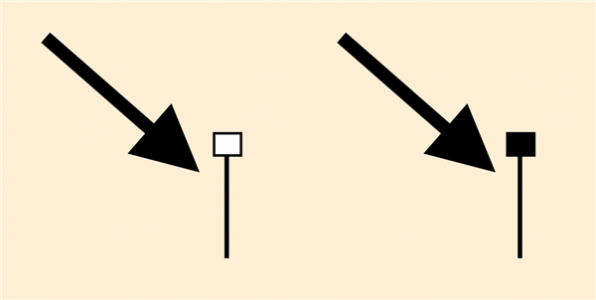
Image1 shows a hammer after a downward trend: The candle body is white or black (depending on whether the opening price is below or above the closing price) and the long fuse points downward.
Description of the Hammer
The hammer is one of the most expressive candles in the candlestick methodology. Its explanation is relatively simple: at a low level, the optimists and bargain hunters grab it, while the pros collect and stop the hands. Further optimists in waiting positions are confirmed by the rising prices in their assessment of a "low" level and a possible imminent trend reversal of the bombed out prices and build up first positions. This can lead to a real trend reversal. What is particularly relevant is that after a downward trend against the prevailing trend, against the advanced panic and against fear is bought. The long fuse of a hammer indicates a clear propensity to buy and a change of mood. However, this buying propensity is not yet the actual buy signal - a trend reversal can only be assumed after further confirmation of the buying propensity by a white candle that is as dynamic as possible. If this confirmation is missing, a hammer is also not a significant trend reversal signal.
Always ask yourself when looking at candlesticks, i.e. also when looking at a hammer: Is there currently a tendency to buy or sell in the market? If you cannot answer this question clearly, you should be in doubt about the future direction. Therefore, it is always advisable not to trade in this case and to decide to maintain the value of your portfolio. This is because portfolio maintenance is the most important rule on the stock exchange.
The hammer shows quite clearly how the relationship between supply and demand relates to previous periods. Here are a few examples that illustrate the use of the hammer.
Image 2: Hammer as trend reversal signal
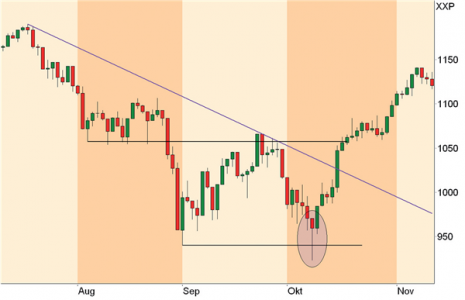

Image 2: The daily candles show a hammer in the price trend of the S&P 500 on October 8, 1998. The hammer confirms an existing support with a long fuse and is confirmed with a following green ("white") candle as a trend-reversing signal.
Important: Hammer confirms support with following white candle The price development of the S&P 500 on October 8, 1998 (Fig. 2) shows a nice example of a hammer. It is virtually exemplary and in this form represents one of the most expressive candlestick patterns.
To explain: After a significant downward movement, the S&P 500 recovered in September and generated support at a level of about 939 points. However, confidence in rising prices had not yet been restored and so at the end of September 1998 the index rebounded again downwards at a resistance level of around 1060 points. What was relevant on October 8, 1998 was that the previous low of 939 points on September 1, 1998 was broken during the course of the day, but a change in sentiment set in during the course of the trading day and the index closed well above the support so successfully tested. Take a look at the long fuse of the hammer ("long" in relation to the previous candle bodies). The expansion of a candle, a wick or a fuse always gives an indication of the strength of the bulls or bears. The confirmation for the hammer as a potential trend reversal signal followed in the S&P 500 already the following day with a white candle. The buying propensity, the change of mood in the market, thus continued and the first price target was therefore the downward trend line. Also interesting is the momentum with which the downtrend was broken with a very long white candle and a W formation formed later.
Conclusion: A hammer with a long fuse after an extended downtrend, which successfully defends an existing support and is confirmed with a following white candle, is a meaningful buy-signal.
Another example for the trading setup "Hammer confirms support with following white candle" can be seen in the price development of Baker Hughes, a US share. A small hammer formed in the weekly candles at the beginning of September 2009 (Fig. 3).
Image 3: Small hammer
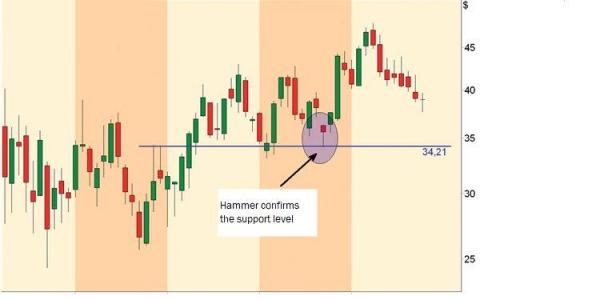
Image 3: A small hammer in Baker Hughes' share price performance as a weekly candle at the beginning of September 2009 confirmed an existing support and offered a short-term trading opportunity.
The hammer was not really meaningful in itself, as there was no previous extended downtrend. Interesting, however, was the hammer's occurrence at a relevant support zone to be assumed at the 34 mark (derived from wick tips in March 2008 and lows in July 2009). The white candle that followed also confirmed the buying propensity that had emerged, at least in the short term, with a first price target of around 39.50 to 40 dollars (the last top of late August 2008) and a second price target at the upper limit of the trading range of around 42 dollars.
Linking the time levels
Hammer in the weekly candles are always interesting - and so it is always worth taking a look at the day candles. Please always link the individual time levels. In this way you get a higher hit rate due to the combination of the meaningfulness of the individual signals. Thus, at the beginning of September 2009, the daily candles in the Baker Hughes share showed a pronounced Harami and subsequently no further selling pressure, whereupon the small gap at the beginning of August was closed with two dynamically rising candles (Img. 4). Ultimately, there were various buy signals at different time levels that complemented each other and promised a successful trade.
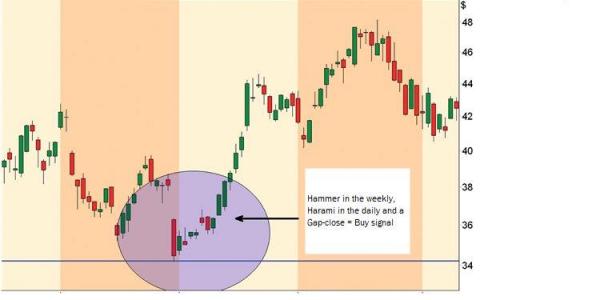
Image 4: Linking different time levels always makes sense. At Baker Hughes there were buy signals based on daily and weekly candles at the beginning of September 2009. The hammer on a weekly basis is derived from the summary of the respective day candles.
One hammer alone does not yet reverse the trend
The most common mistake in the use of candlesticks is not to check samples for their expressiveness or to act on seemingly ideal samples without confirmation. So even a hammer alone does not constitute a trend reversal. A typical example of this is two hammers in short succession in the DAX in July 2004 (Fig. 5). The first hammer on July 9, 2004 occurred at a support level of around 3920 points and confirmed this. However, the following candle pointed further downwards and the buying propensity of the hammer's fuse could not assert itself. Likewise, the second hammer with a long fuse was not confirmed by a subsequent white candle on July 14, 2004. Rather, the price slide at the close of the day below the tip of the hammer's fuse proved to be a further short-term sell signal.
Figure 5: Hammer without confirmation
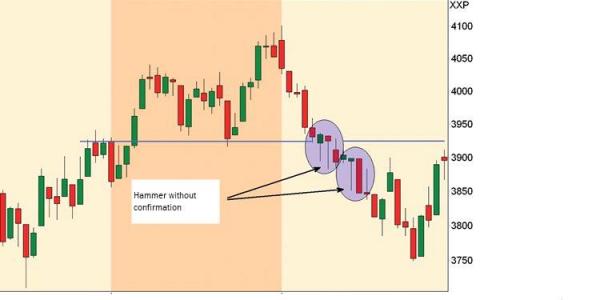
Image 5 shows the chart of the DAX in June/July 2004 with daily candles. In a downward movement, two hammers occurred in quick succession, but they did not reverse the trend. The respective break of the low of a hammer is ultimately a confirmation of the trend.
Indicators check the significance
The expressiveness of the hammer can also be assessed with other aids. For example, with the percentage distance of a moving average to the close of the examined value. This indicator is known as the disparity index or KAIRI. In the case of the DAX described above in July 2004, the KAIRI (38) showed no extreme values relative to a simple moving average of the last 38 days (Fig. 6). This means that market participants did not regard the level at which the hammers occurred as a low "bargain level". There was simply no willingness to invest heavily in the sense of a hammer's behavioral pattern.
Of course, the examination of the significance of trend reversal patterns of candlesticks also works with other common indicators. Thus, RSI, Stochastics or MACD also indicate whether hammers appear in predefined extreme zones or not. Thus, especially confirmed trend reversal patterns receive a higher significance than without the "aid indicator".
Indicators are also relevant in the development of software for automated candlestick pattern recognition. Unfortunately, the above-mentioned trading setups in particular do not occur constantly on a daily or weekly basis. However, if one scans a pool of several hundred securities and shares daily for a hammer either on a daily or weekly basis, one usually gets some reasonable trading opportunities per week. Here the definition of a hammer is still quite common. Indicators then help to filter the patterns according to the trend definition, which can be done using an indicator or a combination of indicators. However, the discretionary estimation of the patterns selected by the software must be done by the trader himself.
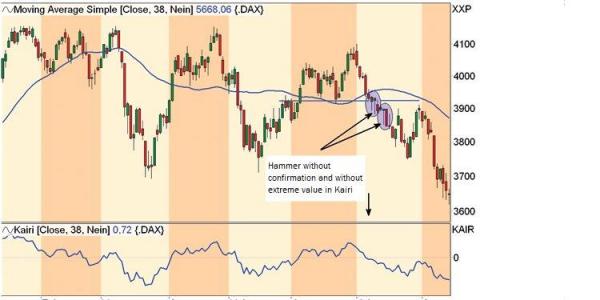
Image 6: Here you can see the chart of the DAX in 2004, shown in day candles, with KAIRI (38). Trend reversal patterns in defined extreme zones of indicators have a reliable informative value. If, on the other hand, there is no overbought or oversold chart situation, the significance of a trend reversal pattern is generally weak.
Conclusion
After a downtrend or a downward movement, the first hammer does not have to be the significant reversal signal. A confirmation of the hammer by a following white candle must be awaited. In addition, different time levels should be linked with each other. The significance of a hammer as a trend reversal pattern can be supported by indicators.