
Do you think that trend lines are too simple to be of much use for actual trading? Find out how, with a little effort and creativity, you can turn a simple idea into a solid strategy.
One of the reasons why trading is a constant striving and searching is the unlimited opportunity it offers to develop new strategies or optimize old strategies. Even a trading strategy that doesn't necessarily work well can contain at least one or two promising approaches. Resourceful traders can start with these strategies and play around with them until they come up with a more effective strategy.
Picture 1: Drawing 1-2-3 uptrend lines

Picture 1: The uptrend line connects the lows A and B, high C is the high of the uptrend. The price breaks the trend line at D and closes below it, swing low E is the low of the price slump. At F, the price tests the swing high (C) again by going back more than 50 percent of the slump from C to E. Selling at G below the support line drawn by E.
Picture 2: Drawing 1-2-3 downward lines

Picture 2: The downtrend line connects the highs A and B, swing low C is the low of this downtrend. The price breaks the trend line at D and closes above it, swing low E is the high of this rally. At F, the course tests low C again by tracing more than 50 percent of the rally from C to E. Buy at G above the resistance line drawn from the swing high at E.
The Trendline is a simple chart tool that many traders have experimented with and modified over the years. In his book Trader Vic, Victor Sperandeo introduces a simple but effective trading strategy that he calls 1-2-3. The three elements of this strategy for a long trade are 1) the penetration of a bearish trend line in a downtrend; 2) a test of the downtrend low; and 3) a break-out beyond the swing high between the break of the trend line and the test of the low (see figures 1 and 2 below). We will now try to further improve Sperandeo's already very effective strategy by requiring the occurrence of at least one of three possible confirming signals before we assume that a 1-2-3 setup is complete:
- a breakout from a "price deadlock."
- high volume, or
- "Windows" (candlestick jargon for price movement) in the direction of the breakout
Before we now examine each of these confirmation signals in detail, let us first turn to Sperandeo's three original premises for his strategy.
Trade trend lines on the award-winning NanoTrader platform.

"The NanoTrader platform is magnificent." – Kai
"NanoTrader is my fourth trading platform and it is by far the BEST platform." – Henry
"I have already familiarized myself a little bit with the platform and I can tell you, that it is the best trading platform I have ever used." – Peter
The original standards
The first condition is a break in the trend line. In his book, Sperandeo shows a new and consistent way of drawing trend lines (see figure 3)
Picture 3: Valid 1-2-3 downward trend line

Picture 3: Here a trendline connects the swing highs at A and B and continues behind the swing low at C without crossing any other price levels. The high after the breakout can be seen at the second candle to D.
Instead of starting at the left edge of a chart and drawing a trend line along the highest swing high (when the price is in a downtrend), start at the current low and look to the left to find the last swing high. Then look further to the left until you find a higher swing high. Next, draw a provisional trendline that connects the two highs. If the trend line does not pass through any price bars (or candlesticks) before it touches the current low of the downtrend, it is a valid trend line. If this temporary trend line passes any bars or candlesticks, it is invalid.
In any case, the first valid trendline does not necessarily have to be the one that is ultimately used to meet the requirements for trendline penetration. Do not stop looking to the left and draw trend lines (usually in the head and not on the chart) until you find the longest trend line which, without passing through bars or candlesticks, is a connection to the last swing high. This is the trend line that the price must penetrate to meet the first requirement of this strategy.
The procedure of drawing a bullish trend line in an uptrend is the reverse of drawing a bearish trend line in a downtrend (see Figure 4): Find the current high and look to the left to find the last swing low. Then look further to the left to find a lower swing low. Then draw a provisional trend line again, which connects the two swing lows. If no price bar or candlestick is passed here either, then this is a valid trend line. However, if it passes through a bar or candlestick on its way from one low to the other, it is already invalid.
Picture 4: Valid 1-2-3 uptrend line


Picture 4: In this uptrend, a trend line connects the swing lows at A and B and then continues beyond the swing high at C without touching or crossing any other price levels.
Now look further to the left and visualize trend lines until you find the longest one, which is a connection to the last swing low without passing through any course bars or candles. This is the bullish trend line that must be broken in order to meet the requirements for the trend line penetration that this strategy requires.
The second component of the original 1-2-3 strategy (in a downtrend) is a test of the downtrend low after the trend line is broken. Let's define a test of the low as a minimum 50% collapse of the price swing from the downtrend low to the high of the breakout rally. In Figure 3, such a slump following a breakout is highlighted. For a price in an uptrend, a test of the uptrend high can be defined as at least a 50% dip of the price swing from the uptrend high to the low, which was reached after the break of the trend line.
The third component of Sperandeo's original strategy (for a falling price) is a break above the rally high after the test or, for rising prices, a break below the downtrend low after the test. At this point we require at least one of our three possible affirmative signs: a breakout from a "price freeze", high volume or a "window".
New confirming signals
Instead of automatically buying the breakout above the rally high after the test in a falling price or the one below the downtrend low after the test in a rising price, we first ask for confirmation by at least one of the three signals.
The first potential confirmation is a breakout from a short "price jam". The logic behind this is that a price may need a sideways movement, at least a short one, before making a sustained movement above the resistance level (for a buy) or below the support level (for a sell short). An uninterrupted run would resemble a V (for a bottom) or an inverted V (for a top); V patterns tend to be very short-lived.
In order for a run to be considered congested, the course must have formed a base of at least three candles near a resistance or support. Three trading days with a sideways trend does not add up to a significant price jam, but a minimum of three days with a sideways trend gives a price at least a chance to catch its breath before starting a new trend.
The second potential sign of confirmation is volume. Although the usefulness of volume as an attribute can be overstated for many chart patterns, it often provides a reliable confirmation for 1-2-3 patterns. In particular, trading volume that exceeds 150 percent of the 50-day average daily volume of a price and occurs near a support or resistance level is a valuable confirmation indicator.
Windows are a final confirmation indicator within our attempt to improve the 1-2-3 strategy. A Rising Window is "open" when today's low is higher than yesterday's high. Assuming high volatility towards the breakout, it can be said that rising windows near resistance levels and falling windows near support levels often lead to successful trades.
Chart Examples
In picture 5 the course forms a swing low at C. If we look to the left, we see a swing high in candle B and a higher swing high in candle A. The trend line that connects the highs A and B and continues beyond point C without touching or passing through another candle is a valid trend line. The candle D closes above the trend line and candle E becomes a rally high above the trend line. The candle F tests the low of candle C, where there is a drop of more than 50 percent of the rally, from the low at C to the high at E, and the course begins its second rise.
Picture 5: Window to a rally

Picture 5: Rising windows (or gaps, also called "holes"), which open before or after the price breaks out and closes above the resistance level (at candle H), confirm the 1-2-3 setup.
The rising window at G (between the second and third candlestick after F) suggests that a subsequent breakout above the resistance level will be successful. The rising window at H (between the fifth and sixth candle after F) is another indication that the price will continue to rise.
Picture 6 is another example of how rising windows lead the price up. The trend line starts at C and continues to the left through the swing highs B and A, but without crossing other candles.
Picture 6: Resistance becomes support

Picture 6: Rising Windows at H and I confirm this 1-2-3 setup. After the break above the resistance line, the price tests this line again (at J), which in the meantime has moved to a new support level.
Candle D is a piercing line variation, a bullish candle pattern. A perfect piercing line opens below the depth of the previous candle and closes at the level of the middle of the body of this candle. In this case candle D opened a little bit above the depth of the previous candle, but it is still a quite strong constellation.
The price closes above the trend line at candle E and then forms a swing high at candle F. Candle G, a bullish-engulfing line, tests the low of Candle D by a dip of more than 50 percent of the distance between the D low and the F high. Next, two Rising Windows open at H and I, which is the additional confirmation we need to get into a 1-2-3 trade. Finally, note the pull-back to the old resistance level (and at the same time new support level) at J - a very common occurrence in 1-2-3 patterns.
Volume is the confirmation indicator in the next example. Candle C is the low of the downtrend. Candle D in turn closes above the trend line. A small rising window opens between candle E and the previous candle. E represents the swing high and F tests the previous lows by collapsing more than 50 percent of the range between the low at C and the high at E. Finally, the high trading volume of candles G, I, J and K pushes the price through resistance and on.
Picture 7: Confirmation by volume

Picture 7: Five days of very high volume (three before the eruption and two after) confirm this 1-2-3 setup.
Picture 8 is an alternative to the trend lines normally drawn in 1-2-3 patterns. Note that A and D are the only swing highs we can use for a trend line, but this trend line is invalid. It goes through the tips of candles B and C. If no valid trend line can be drawn (sometimes there are no swing highs in a downtrend), a moving average can be used instead.
Picture 8: Price accumulation along the resistance level

In this example, the price crosses above an eight-day exponential moving average (EMA) at F, completing an EMA variation of the normal trend line break. The swing high at G becomes a resistance and candle H tests the downtrend low with the break over more than 50 percent of the distance between the low at E and the G high. Candles I to L (and here especially the upper shadows of candles I, K and L, as well as the body of candle J) mark four days of price stagnation near the resistance, confirming our 1-2-3 pattern. After candle L a rising window opens and a strong uptrend begins.
A price jam is also the confirming indicator in Figure 9, the first example of a short sale with the improved 1-2-3 strategy. If we look to the left of the high of the uptrend (candle C), we discover the swing lows at B and A and connect them to draw our trend line. The price exits below the trend line at D, forms a swing low at E (which becomes support) and tests the earlier high of the uptrend at C by breaking more than 50 percent of the price drop from C to E. Candle G is the first of five others to make a sideways move along the support level. The 1-2-3 pattern is completed by a price close below the support level at H.
Picture 9: Price jam along the support level

Picture 9: Candle G initiates a price stagnation period along the support, which extends over five candles. Candle H is the first candle to close below the support level.
In picture 10 the trend line connects the swing lows at B and A. Candle C closes below the trend line, candle E is the swing low that will serve as support and candle F tests the uptrend high by slumping over 50 percent of the downward movement from the high at C to the low at E. A short stagnation phase begins at candle G: The price moves mostly sideways for four days. Afterwards it falls through the support to rise immediately afterwards to this level, which is now the new resistance. The price trades along the resistance for another four days and then falls again.
Picture 10: Confirmation of a sell-off

Picture 10: Four days of course congestion starting at G and D. The price falls until the new resistance or the old support at H. The subsequent sell-off is drastic.
The last example (picture 11) is a 1-2-3 pattern confirmed by volume, a breakout from a price jam and a falling window. Candle C is the high of the uptrend. The swing lows B and A are connected to a trend line and the price closes below the trend line at candle D. Candle E represents the low of the first price drop and candle F tests the high at C. Candle G is a so-called Grave-stone Doji, a bearish candle pattern. Candle H represents a significant increase in volume followed by eleven days of mainly sideways movement along the old support or new resistance level.
Picture 11: Multiple confirmations

Picture 11: This example contains all three new confirmation indicators of the 1-2-3 strategy: a breakout after a price freeze, a window and high volume. Once again, the support line is tested from Candle E after breaking to the resistance line and then again at Candle I.
Finally, a small falling window opens between the low at J and the high at K and an actual downtrend begins.
Picture 12: Multiple confirmations

Picture 12: This example contains all three new confirmation indicators of the 1-2-3 strategy: a breakout after a consolidation, a window and high volume. Once again, the support line is tested from Candle E after the breakout to the resistance line and then again at Candle I.
Final thoughts
Viktor Sperandeo's 1-2-3 trend reversal strategy is an absolutely perfect example of the effectiveness of a plain and simple chart based equity trading strategy. By adding three additional possible confirmation indicators, we have been able to further improve this already very solid and tangible strategy.
The good news is that many other well-known strategies that have proven their worth over the years continue to signal profitable trading opportunities, even in today's volatile market environment. But the even better news is that these strategies can often be further optimized by investing a little effort and imagination.
Candle charts are based on the same price information as normal bar charts. However, candlesticks indicate bullish or bearish activity by their color. The highs and lows reached during a trading day are reflected in the highest and lowest points of the candlestick respectively, while the opening and closing prices are marked by the upper and lower edges of the wider part.
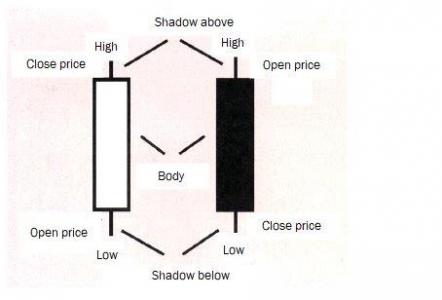
The thin strokes at the top and bottom are called shadows and the wider part of the candle body. The candle is white (hollow) when the closing price was above the opening price and black (filled) when the closing price was below the opening price.

1) Doji
A doji is a candle with the same (or almost the same) opening and closing price. This pattern shows that the bulls could not start a rally to close above its opening value and the bars could not maintain the declining price that would have closed below its opening value.
2) Gravestone Doji
A Gravestone doji is a candle with a long upper shadow and no kerper, as the opening and closing prices are both at or near the daily low. This candle is a baric sign.
3) Piercing Line
A piercing line is a bullish candle, which opens below the low of the previous candle and closes in the middle at body height of this candle.
4) Bullish Engulfing Line
A Bullish Engulfing Line is a long candle within a downward trend with a white body that 'swallows' the body of the previous candle, overlapping it on both sides.
5) Bearish Engulfing Line
A Bearish Engulfing Line is a long black candle within an uptrend, which covers the body of the previous day's candle, i.e. it was completely covered when placed on top of each other.
