This is how you use the support and resistance levels. Pivot points are prominent support and resistance levels calculated from the previous period. The fact that pivot points have their origin in pit trading (floor trading) does not need to be explained here. What should be noted, however, is the fact that one of the biggest traders on the stock markets, Jesse Livermore, had them in his repertoire. Pivots are one of the basic components of technical analysis. The following article explains how pivot points work and shows how to use them using a specific trading strategy.
Pivot level
In the following we distinguish between five different pivot levels, whereby the "hardcorers" use two additional levels - but these are less meaningful because they are too rarely reached (with the exception of the DAX future). In any case, two resistance levels ("r" for restistance), the pivot point itself (PP) and two support levels ("s" for support) continue to be used in pivot trading. The calculation of pivots is simple and pivot trading is therefore popular:
- PP = High Yesterday + Low Yesterday + Closing Price / 3
- r1 = 2 x PP - Deepestar
- r2 = PP + (high yesterday - low yesterday)
- s1 = 2 x PP - high yesterday
- s2 = PP - (high yesterday - low yesterday)
Pivot points
Mathematically, we distinguish two different types of pivot points: In addition to the above mentioned formula for the pivot point, there is another formula in which the opening price is added to the calculation. Both have their place in the market, and the first mentioned pivots are used more often. In addition, we distinguish the time frames in which pivots can be calculated and traded. For intraday trading, daily pivots are the measure of all things. For the longer time frame, however, the monthly and annual pivots come into play (see FDAX, where we bounced off the annual pivot twice). With annual pivots you can use very aggressive phalanx strategies, which are very aggressive in price but not in risk.
In the American futures markets there are two different ways to use pivots: either in the normal trading session from 15:30 to 22:15 or in the 24-hour display. In the Forex market, pivot points are calculated at 23:00 CET for the new day. Last but not least, there are the so-called "intraday pivots" or "reversal points" (V-bottoms and V-tops), which show important support and resistance levels in the chart. These intraday pivot points are very helpful in trade management.
Properties of Pivots
- Pivots show very good resistance and support.
- They are ideal for short-term trading such as high frequency or scalp trading.
- They clearly indicate when it is best to stay out of the market.
- The size of the distances from the pivot to the resistance or support points shows what happened the previous day, such as a Narrow Range Day or a Wide Range Day.
- Pivots have a high hit rate as a profit target.
- If you want to trade the initial, you need big stops. The initial is the first attempt to trade the pivot point. As a rule, the price bounces off. The CRV (chance/risk ratio) is also pushed downwards.
- The dynamics at the pivot are usually sluggish due to accumulations or distributions by institutional investors.
- If the underlying is wandering around in a directionless manner, it is usually only the third attempt to break a pivot that is profitable. Then, however, it comes down to business at a furious pace.
- Important Rules for Trading with Pivot Points
- If, after a strong previous day, the market price moves between pivot point and r1 or s1 with little momentum, you stay out of the market because in this constellation most loss trades occur.
Important rules for trading with Pivot Points
- If, after a strong previous day, the market price moves between pivot point and r1 or s1 with little momentum, you stay out of the market because in this constellation most loss trades occur.
- If the previous day was a narrow range day, the underlying will try to find the pivot point again and then break away up or down depending on the trend phase we are in (up or down trend).
- If the underlying stabilises after a strong sell-off in the area below s2 and then moves upwards through s2, the primary target is the pivot point. This does not have to be the take profit (= closing out of positions) (Fig. 1). The same applies to the short side: If the underlying stabilizes after a strong upward movement above r2 and trades from top to bottom through r2, the target must be found on the pivot.
- In American futures, pivot points are much more important than in other underlyings.
- Specific for trading in the FDAX: The FDAX is a diva that likes to take its time to trade the initial. The best way to trade the FDAX with the pivots is to wait for a break. This means that you should not take action until the pivot point is broken.
Image 1: DAX futures stabilize below s2.
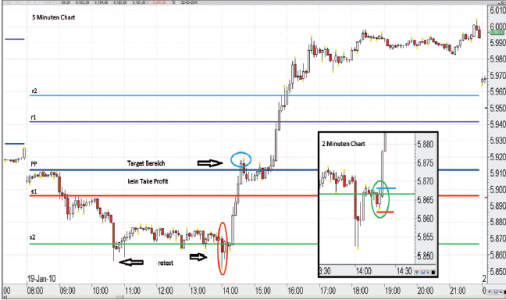
Image 1: Shows a counter trend strategy in the DAX future. The FDAX is traded lower all morning until it breaks away at 14:00. However, the FDAX cannot hold this low and eventually trains a Bullish Engulfing, which in itself is a strong reversal setup. Disadvantage: The stop is much too big. The change on the 2-minute chart shows the same entry setup (bullish engulfing) with lower risk. In countertrend strategies, the pivot is not the take profit, here management is in demand. As a rule, it goes far beyond the pivot. It is best to look for the target on r2 or use partial exits.
Specifications for the long side
Opening trade: We need an upgap that is not larger than ten points and must be above the pivot point. The time between the opening at 08:00 to 09:00 is not meaningful enough, as there is often little dynamism in the DAX future during this time. The DAX should only not move too strongly upwards. It is best if the DAX future falls slightly into the regular opening at 09:00 a.m. and closes the gap to the previous day. For entry, we are looking for a bullish engulfing pattern, a hammer, a pricing pattern or other strong reversal patterns. The entry signal occurs as soon as the market forms a strong reversal candle and the high is taken out with the next candle.
Example of a DAX future (Img. 2)
The DAX future opens on March 10, 2010 with an upgap and returns to the pivot point shortly after 09:00 a.m. in a controlled manner. The gap will be closed. It is important to note that the gap must not be larger than ten points, which is one of the main criteria. At 09:30, the DAX future begins to stabilize at the pivot point. From this point on, you switch to the smaller 2-minute timeframe. Firstly, this reduces the risk and secondly, the entries there are much clearer.
On the 5-minute chart one would not have been triggered in this trade because a small upgap in the price occurred at the next opening. On the 2-minute chart, however, the trade is triggered before the end of the 5-minute candle (green line in the green circle) because the price closes above the pivot. The position is in the market and the stop is placed one point below the trade triggering candle (red line in the green circle).
Now the phase of managing begins. The stop remains in negative territory until the first 5-minute high (08:00 to 08:05) is traded through and closed above it. From now on the trade is managed according to the Higher-High-Trailstopp-System. This means that as soon as the DAX future takes out a significant high, the stop is placed at the last higher low. At 10:30 a.m., the DAX future forms the desired high. This is the first point that is striking for the trail system.
Now you have to wait until the market takes out this high. At 15:40 the high of 10:30 is traded through and you can place the stop below the low of 11:25. As soon as the DAX future reaches r1 and trades through, you can adjust the stop to the last higher low at 3:15 pm. As soon as the r1 is traded through, the sell limit must be positioned on the r2.
Image 2: Example for the long side
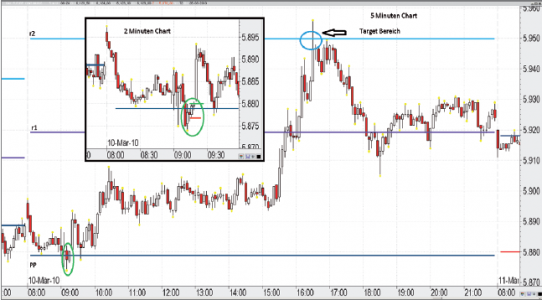
Image 2: The market opens with an upgap that is no larger than ten points, then tests the pivot and then bursts upwards. The entry point is on the 2-minute chart (green circle on the green line). The target is located at r2. After entering, the DAX future tests the low once again and then breaks upwards. After the DAX future has formed a new high (10:30 a.m.), the market enters a long sideways phase. Only at the opening of the American markets does the FDAX break upwards. After breaking out of the range and trading the r1, the stop is placed below the last swing low on the 5-minute chart.
Specifications for the short side
It looks the same on the short side: If the DAX Future opens with a downgap, the best thing for it to do is close the gap first and then overshot it. This almost ensures that enough traders willing to buy are lured into the market. For the entry on the short side we are looking for strong single reversal patterns, for example a shooting star or a high wave candle. In both cases the entry into the smaller time frame is to be looked for, since these are afflicted with the smaller risk.
Example of the DAX future (Img. 3)
On the short side, net opened the DAX future with a downgap. Again, the gap must not be larger than ten points. After opening, the DAX future falls, takes out the first 5-minute low and then moves up. At the pivot point, a high wave candle appears in the 2-minute chart (green circle), which forms the entry setup for the short side (green line). The stop is placed one point above (red line) and remains there for the time being. A Bearish Engulfing pattern has formed in parallel on the 5-minute chart, providing even more security for the existing position. The 5-minute chart is now changing to trade management. After the fifth candle, the stop is placed from negative to positive. Since you don't have the opportunity to manage the trade with the lower high system, you have to hedge the position over the first 5 minute high of the day after reaching the s1. As a result, the market changes into an unclear situation: It forms a new low, but then returns to s1 again and then collapses. As soon as the market has taken out the 10:45 low, the buy limit (blue circle) is placed in the market.
Image 3: Example for the short side
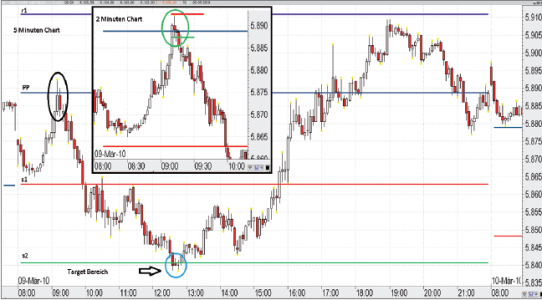
Image 3: After a downgap, the DAX future starts a retest of the pivot point. Here it is important to make sure that it is really just a retest. The market forms a high wave candle on the 2-minute chart and then breaks away downwards. The FDAX runs relatively smoothly until the s1 breaks. Then the momentum slows down and trading becomes difficult. Only when the attempt is made to break the s1 upwards does the momentum on the short side come back into the market. After the s1 has been tested again, the FDAX finally breaks down to s2. These are market phases in which most traders lose money.
Trade management using the example of a long trade
Since this is an opening strategy, the first 5-minute high gets a very special meaning. If we find a significant reversal setup at or near the pivot point (for example, a bullish engulfing pattern), the high of the bullish candle is the entry setup. The safety stop is placed one point below the trade-triggering candle. This safety stop remains negative until the market trades the first 5-minute high (candle from 8:00 a.m. to 8:05 a.m.) and then closes above it. This is a very important factor for this strategy.
From this point on, the safety stop is placed at the trailing stop and one point above the entry candles. Now the position is no longer negative and you no longer trade at your own risk. The next stop adjustment point comes when the market reaches r1. From this point on, the stop is placed one point below the last higher low. As a rule, the market starts to jump in price. As soon as this behavior is visible in the chart, place your sell limit exactly on the s2.
Trade management using the example of a short trade
On the short side, which is usually much faster, things look a bit different: Here it is advisable that, once the trade has been initialized, the stop is first placed above the candle that triggers the trade and remains there. You should also take the entry and the risk stop out of the 2 minute chart and the trade management out of the 5 minute chart in order to get the most out of the movement. Once the market has formed its fifth 5-minute candle (five is a number from the Fibonacci series), the safety stop becomes a trailing stop. However, it is also possible that the first 5-minute low is taken out of the market first. In this case you can also set the stop to break even plus one point. What comes first is implemented.
Conclusion
Due to its uncomplicated mathematical calculation, pivot trading is easy to use, but the devil is in the detail. This means that you have to have a good understanding of the market anatomy. So it is not enough just to draw the brands on the chart and then blindly act on them. That would be a very expensive undertaking. The best way to use pivots is to use them in combination with candlestick patterns, which increases the chances of a successful trade. It should also be added that not every market is tradable with pivot points. Some of the features that may speak in favor are futures contracts with a daily trading volume of more than 100,000 units.
Fascinating series of successes for WH SelfInvest in the choice of broker. Ones again in 2019!
In the annual broker election, traders voted WH SelfInvest "No. 1 Futures Broker" and "No. 2 CFD Broker". In an incredible five of the last six years, WH SelfInvest was voted the best futures broker and clearly beats all its competitors.
In CFDs, WH SelfInvest was only 0.1% behind this year's first place.
In short, the clients are very satisfied with the low commissions, the outstanding order execution and the legendary service.