Trading articles
Flag by candlelight

Just as you need more than a wall to keep a roof up, you need more than a trading idea to achieve consistent profits. The combination of flags and candlesticks can produce better results than any approach alone.
The hammer

Traders are always looking for advantages, and if we believe the textbooks of technical analysis, candlestick formations can give us such an advantage in analysis and trading. Haramis, engulfings and hammer are promising names, but what power do candlesticks really have? In this article we will look at one of the most famous candlestick patterns, the Hammer.
Trading with the Supertrend

If you don't have a plan on the stock market, you're playing for luck. I don't know about you, but I don't want to rely on my luck alone, so I need a plan, a strategy.
Trading trend lines in 3 easy steps

Do you think that trend lines are too simple to be of much use for actual trading? Find out how, with a little effort and creativity, you can turn a simple idea into a solid strategy.
ATR: Inspecting volatility

One name that keeps coming up in connection with the charting tools that are now called classic indicators is that of Wilder. The Average True Range is no exception, which was also developed by Wilder and is one of the most widely used volatility measures within technical analysis today.
Expanded triangles - Expanded horizons

The inverse version of a triangle formation can initiate swing trades and helps to profit from false breakouts and enter price movements early. Trading would be so easy if uptrends would always consist of rising support and resistance points and downtrends would always consist of their falling counterparts.
Inside Out - Boy you turn me

A failed chart formation doesn't need be the end of the trade. It can be the beginning of a new fantastic trade if you know what to look for.
Discover chart formations on the award-winning NanoTrader platform.
Build it with Renko

Origin and meaning
Renko charts have been used in Japan for more than a hundred years. It is not known exactly how they were created. A renko chart consists of many price blocks. These blocks are designated with the Japanese word "Renga" for brick. It is assumed that the term "Renko" comes from the Japanese "Renga".
Shoulder-head-shoulder

The shoulder-head-shoulder formation (SHS for short) is one of the best known formations at all and can be found in almost every beginner's work for technical analysis. We show you the logic behind it and how you can use the SHS in your trading.
Triangle trading

Triangles are among the most recurring patterns in trading. Here are the basics and some guidelines on how to trade them more reliably.
VWAP: A daytraders essential

The VWAP can be an important support for day traders in assessing the significance of resistance and support areas for liquid equities. This article shows how the indicator works and how traders can apply it in practice.
Why does the VWAP influence daily market activity?
Key concepts part 6

In the "Key concepts" section, we explain the basic concepts of trading that are necessary, above all, for understanding our strategy articles. The aim is to introduce beginners to complex strategies and at the same time give advanced traders the opportunity to refresh their basic knowledge.
Are you looking for an outstanding futures and CFD-Forex broker?
CCI: More than commodities

In this article we would like to introduce the Commodity Channel Index (CCI), which was developed in 1980 by commodity trader Donald Lambert. In this article we show how to calculate the versatile trend follower and what valuable services it provides in practice.
The right risk and money management in every market phase
It is clear to traders and investors that the markets are moving. But the intensity of this movement is often a headache for market participants. The volatility of a market is a central element in the analysis. It provides information about how strong or weak the markets are moving and is therefore very suitable for placing stops correctly. A special type of volatility calculation is the so-called "Average True Range", or ATR for short.
Key concepts part 5

In the "Key concepts" section, we explain the basic concepts of trading that are necessary, above all, for understanding our strategy articles. The aim is to introduce beginners to complex strategies and at the same time give advanced traders the opportunity to refresh their basic knowledge.
Three Line Break - breakthrough in a chart

In the context of the discussion of Japanese chart techniques, the "three-line breakthrough charts" are discussed here. This chart, too, is rarely found in technical analyses. Nevertheless, it also offers the investor some advantages that cannot be dismissed.
Trade Three Line Break on the award-winning NanoTrader platform.
TA on FX

Most of the tools provided by Technical Analysis (TA) can be used well in foreign exchange trading. Classic chart formations such as trend channels or resistance and support lines can be used as well as advanced trend detection techniques, indicators and oscillators, and candlestick formations.
Key concepts part 4

In the "Key Concepts" section, we explain basic trading concepts that are necessary, above all, for understanding our strategy articles. The aim is to introduce beginners to complex strategies and at the same time give advanced traders the opportunity to refresh their basic knowledge.
Key concepts part 3

In the "Key Concepts" section, we explain basic trading concepts that are necessary, in the first place, for understanding our strategy articles. The aim is to introduce beginners to complex strategies and at the same time give advanced traders the opportunity to refresh their basic knowledge.
Rangebars - The new tool for scalpers

New developments for traders are rarely found anymore. Everything was already there and was warmed up in one way or another - only in a new guise. An exception in the area of chart types are the so-called "Rangebars", which find their application especially in the intraday area. We would like to present the concept in this article.
Heikin Ashi - balancing on one foot

Most often, profits (but also losses if there are no stops) are made when there is a trend-oriented movement in a market. The correct assessment of the probable trend can therefore be extremely helpful and profitable. The Heikin Ashi technique combines the advantage of charting using Japanese candle charts with an improved representation of the prevailing trend direction.
Chartformations (part 1)

Here we have an article from the series "Chartformations". So-called "chart formations" occur in all markets and on all time levels and should belong to the toolbox of every trader. Today we present the two best-known chart patterns that indicate a trend reversal: the shoulder-head-shoulder and double top and double bottom formation.
ATR as an efficient stop

The Average True Range (ATR) is an indicator based on price differences between two trading days and is regarded as a seismograph of volatility. We will show you how to use the ATR for the setting of
stops and the creation of positions.
Trading naked?!

The beauty of trading is that you can theoretically operate it from anywhere in the world - at your desk, in your living room or in your holiday paradise. Nobody cares whether you sit in a suit and tie in front of the computer or in a jogging or swimming trunk. And the trading platform can be as casual as the screen. Have you ever tried it naked?
Key concepts part 2

In the section "Key concepts" we explain basic concepts of trading, which are necessary for the understanding of our strategy articles. The aim is to introduce beginners to complex strategies and at the same time give advanced traders the opportunity to refresh their basic knowledge.
Orderflow trading

Orderflow trading has been enormously hyped in the English-speaking trading scene in recent years, while it is less well known in German-speaking countries and is traded by some as an "insider tip" or even as the "only true trading". This does not mean, however, that one can find the proverbial Holy Grail here.
In this article we look at what Orderflow Trading really is about.
Tip
Trend following with Renko charts

Renko is a simplifying and optically very clear presentation form for price data. Renko has many advantages for the development of trading systems. Patterns, chart technical aspects and trends are easy to describe and offer little room for interpretation.
Key concepts part 1
In the "Key concepts" section, we explain the basic concepts of trading that are necessary, above all, for understanding our strategy articles. The aim is to introduce beginners to complex strategies and at the same time give advanced traders the opportunity to refresh their basic knowledge.
Bollinger Bands
Heikin Ashi versus Candlesticks
The regular ups and downs at the markets can become a real test for the nerves of many traders. Whether a position is currently held or the market is only observed - the back and forth regularly leaves plenty of room for personal interpretation. Although a trend in the market is often recognizable, there are always phases in which false signals can mislead a trader and he runs the risk of prematurely taking a position or dissolving it. In these moments it is difficult to stay calm and keep track.
Heikin-Ashi: A variation of the Candlesticks
Aug '19: Fake trend reversal
In order to consider a "fake" trend reversal, the following criteria must be met:
- the market is in a prolonged trend.
- the market reverses trend.
- this trend reversal is not strong.
- the market moves sideways for a moment.
- the market turns back in the direction of the initial trend.
To obtain a trading signal, two technical analysis indicators have been combined: a crossing moving average and the smoothed Relative Strength Index indicator. The RSI is an oscillator which indicates if a market is overbought or oversold.
Aug '19: Three Line Break (TLB) - Version 2
Multiple trend reversal signals based on TLB bands
Both this multi-signal and the mono-signal tool are based on trend reversals identified in a very interesting chart type called Three Line Break (TLB) chart.
The TLB chart is interesting because it visualizes a trend reversal. However, the TLB chart is difficult to interpret given the fact that it has a variable time axis. The strength of this signal lies in the fact that it visualizes this complicated yet useful chart as a simple band. This green-red band is visible in the main chart.
Aug '19: Three Line Break (TLB) - Version 1
Trend reversal based on TLB bands
This signal takes position in the early stages of a potential trend reversal. The trend reversal is identified by a very interesting chart type called Three Line Break (TLB) chart.
The TLB chart is interesting because it visualizes a trend reversal. However, the TLB chart is difficult to interpret given the fact that it has a variable time axis. The strength of this signal lies in the fact that it visualizes this complicated yet useful chart as a simple band. This green-red band is visible in the main chart.
Master of patterns - Wedge formations (2)
As with all correction patterns we present to you within this series of articles, a trend is also the most important prerequisite for wedge formation. Only if you know in which direction the price trend is going can you look for the appropriate correction patterns. That's why we're taking a short trip into the world of trend determination at this point.
Determination of trends
Master of patterns - Promising formation (1)
Chart patterns can be used to identify typical chart situations that have evolved over time as a result of the actions of market players. Frequently, dissolving these patterns leads to lucrative price movements. In this series, we would like to introduce some of these patterns to you so that you can improve your market assessment and timing.
Volume indicators - Short term trade against the masses
Often the market is showing strong volatility when corporate news or macroeconomic data is released. Since almost all traders interested in a certain underlying value follow the corresponding news and many of these traders actively trade the events, volumes and emotions for these events increase particularly strongly. "No price in the world will always rise or fall, the reaction is exaggerated," could be their opinion about the sometimes immense moves.
More profit, less risk

How to act successfully with the trend
Jul '19: Market structure points
Market structure points are important chart patterns, which every trader should be able to identify and keep an eye on. Two types of market structure (MS) points exist:
Jul '19: Gap close
This signal occurs after an intraday gap has been closed. The assumption is that the trend is back on track after the gap closes.
A gap is defined by comparing the open price of the current candle and the low price (high price in the case of a gap up) of one or more previous candles.
This example is showing a Gap down, because the close price of the previous (green) candle is considerably higher than the open price of the current (red) candle.
Jul '19: Bollinger Volatility explosion
The creator of the Bollinger Bands, John Bollinger, states that periods of low volatility are often followed by periods of high volatility. When volatility increases, Bollinger Bands widen. John Bollinger further states that an "explosion" in volatility offers an opportunity for traders.
This trading signal detects when a volatility explosion based on the Bollinger Bands occurs. In order to measure and visualize the explosion, NanoTrader displays the volatility in percent in a chart below the main chart. This indicator is called the Bollinger Bands Volatility Oscillator.
Jun '19: Inside Bar Break-out
The "inside bar" candlestick pattern is a chart pattern which consists of a series of candles that are all closing inside the High-/Low range of the first candle of the series, often referred as the outside bar. This means that the close price of the current candle is both lower than the high of the first candle and higher than the low of the first candle of the pattern.
Jun '19: Heikin Ashi reversal
This signal takes positions in the early stages of a potential trend reversal. It is based on the Heikin Ashi trend indicator. The visual representation of the Heikin Ashi indicator resembles a classic candlestick chart. As a consequence many trading platforms classify this indicator not in the list of indicators but in the list of available chart types.
The trend indicator Heikin Ashi visually resembles a candlestick chart. Each Heikin Ashi candle, however, is calculated on the basis of the previous Heikin Ashi candle and the current classic candle.
Jun '19: Hammerblast
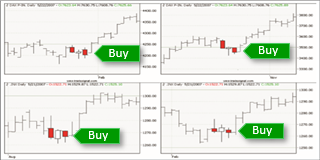
The Hammer Blast pattern occurs at the end of a down-trend. It often reflects a change in the sentiment of the market. The pattern works well for market indices (DAX, DOW…) and individual stocks.
The Hammer candlestick pattern consists of four candles. The two first candles need to be bearish candles. The third candle needs to be a Hammer candle. The fourth candle must be a bullish candle. The open of the fourth candle must be above the close of the Hammer candle.


