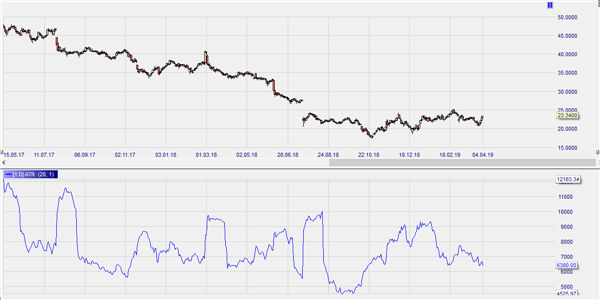
The Average True Range (ATR) measures the movement of the market by repeatedly comparing the price range (True Range) of two successive bars.
Click here to see ATR inside a real time trading platform.
High values in the Average True Range are often seen just before a trend reversal. Low values are frequently an indication of a horizontal market, but can also signify a trending market without large price movements.
The curve of the ATR shows similarities with the volatility and standard deviation indicators.
Active traders use the ATR more extensively, as it can also be used to define stops. If the ATR is high (volatile market), these will usually be more relaxed than with a low ATR. Given that the value of the ATR is directly related to the market being analyzed, it can be used to define stop-loss levels.
PARAMETERS
- MA period
BUY AND SELL SIGNALS
N/a
DIVERGENCE
N/a
INDICATOR TYPE
Various