The momentum or Rate of Change (ROC) indicates the increase or decrease of the closing price relative to a previous price.
Click here to work with the ROC inside a real time trading platform.
Generally, the momentum value oscillates between fixed values. If the deviation versus this value is large (small), then this suggests the market is overbought (oversold). Although this indicator is often classified as an oscillator, the ROC indicator mostly delivers its best results in a trend market. In trading-market phases, the results are largely less impressive.
Click here to get a free demo account.
PARAMETERS
- Momentum period (14)
BUY AND SELL SIGNALS
Crossings with the zero line generate a buy (rising momentum) or a sell signal (declining momentum).
DIVERGENCE
Yes
INDICATOR TYPE
Oscillator
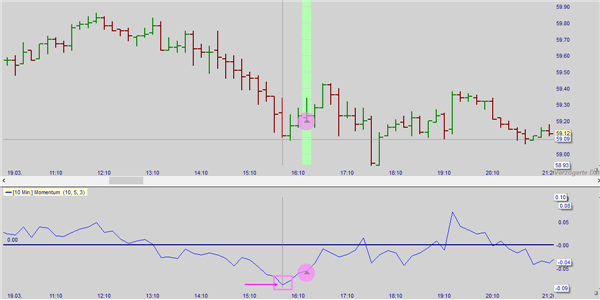
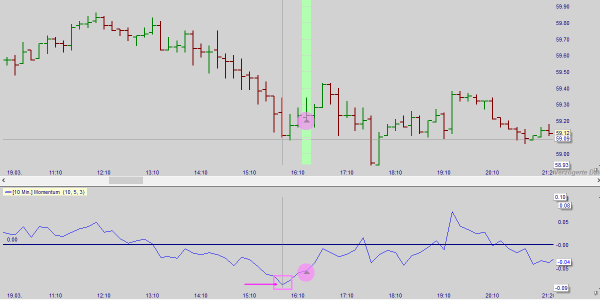
In the following example of a 10-minute chart in the NanoTrader platform, a variant of momentum was used. It uses an observation period "before" and "after" an extreme point. An end of a downward swing occurs when "Span Left" periods fall the curve and then "Span Right" periods rise. An end of an upswing occurs when "Span Left" periods rise the curve and then "Span Right" periods fall. An upswing occurs when the current value of the curve is greater than the value of the previous period.
Click here to get a free demo account.
Momentum is thus a simple indicator that reflects the strength of the trend. If the price rises sharply, the momentum will rise well above the zero line. If the intensity of the slope decreases, the momentum will form a top and then return to the zero line. At this moment you should sell. If the price falls sharply, the momentum will decrease to below the zero line. If the strength of the downward movement decreases, the momentum will form a bottom and tend upward towards the zero line. A cross of the zero line would then be a clear buy signal.
Further variants of momentum within the NanoTrader platform are:
- Dynamic Momentum Index
- rate of change
- percentage change

Free newsletter: Trading signals based on technical analysis.
The analysis of the market has become easy! Create your own daily newsletter with signals based on important concepts of technical analysis. All your preferred financial instruments are available.
It's that simple. REGISTER HERE