
Just as you need more than a wall to keep a roof up, you need more than a trading idea to achieve consistent profits. The combination of flags and candlesticks can produce better results than any approach alone.
The potential profits from trading are so great that there is fierce competition in the markets. The markets do not exist to give easy money to beginners; instead, they repeatedly redistribute the wealth of the many beginners to the few successful ones.
One of the many mistakes that beginners make is that they think they know a lot about technical analysis because they make very fast progress. Unfortunately, the markets don't reward amateurs or dreamers with fast fortunes simply because they know how to spot a double top or calculate a moving average, since the rest of the competition also has that knowledge.
However, a trader can cut a piece of the pie by cleverly combining two trading concepts in a method that is more than the sum of its parts - synergy.
Discover chart formations on the award-winning NanoTrader platform.

"The NanoTrader platform is magnificent." – Kai
"NanoTrader is my fourth trading platform and it is by far the BEST platform." – Henry
"I have already familiarized myself a little bit with the platform and I can tell you, that it is the best trading platform I have ever used." – Peter
Buckminster Fuller uses this term in: Synergetics: Explorations in the Geometry of Thinking. As an example, Fuller tells of aerospace engineers who were looking for a metal strong enough to withstand the intense heat and pressure of jet combustion. The jet engines they kept building broke or deteriorated too quickly in practical use. Eventually they came up with an alloy of chrome, nickel and steel that proved to be successful. Although the engineers could not build a durable jet engine with one or two of these metals, the mixture of three worked exceptionally well. Similarly, a simple but effective mixture of flag patterns and Japanese candlesticks creates a synergistic trading process - that is, a whole that is better than the sum of its parts.
Image 1: Bull flag
A bull flag is a short consolidation after a rise (the flagpole). Traders usually go long when prices break out of formation on the upside.

Image 2: Bear flag
A bear flag is a short consolidation after a break-in (the flagpole). Traders usually go short when prices break out of the formation downwards.

Flags: Short-term outbreak patterns
A flag, the first component of our new process, is a common bar chart pattern, which usually leads to a continuation of the underlying trend. A bullish flag (Image 1) is a downward parallelogram that sometimes forms after a sharp price rise (practically the flag stand). The upper border of a bullish flag connects two or more falling highs, while the lower border (which is parallel to the upper border) connects two or more deeper lows. When prices break above the top of a bullish flag, the upward trend usually continues.
A bearish flag (Image 2) is an upward parallelogram that sometimes develops after a steep price slide (inverted flag stand). The lower border of the bearish flag connects two or more rising lows; the upper border (parallel to the lower border) connects two or more higher highs. A break below the lower limit typically signals a resumption of the downtrend.
Candlesticks: Revealing hidden price dynamics
Japanese candlestick charts, the second component of this synergistic process, are based on the same information as the normal bar charts (Open, High, Low, Close), but also highlight price features that are not immediately visible in the bar chart. The box "Candlestick Basics" explains how candlesticks reflect price movements. Although candlesticks use the same price data as bar charts, the display mode helps identify shifts in supply and demand that indicate potential momentum and trend changes. Accordingly, candlestick patterns can be combined with other techniques to improve timing. For example, candlestick patterns that occur frequently within flags signal entry points earlier than outbreaks from flags. Figure 3 shows a rapid rise (the flag stand) from A to B, followed by a flag. Traders would routinely enter this trade at D when prices break out of the flag.

However, a candlestick pattern, a morning star, offers a better entry price within the flag. In the downward move, which starts at the top of the flag two days before C, a large black candle is followed by a shorter candle whose real body forms a gap with the real body of the large candle. Although the shadows of the two candles overlap, the Japanese consider this a gap (they call it an "open window") because the candle bodies of the two candles do not overlap. The morning star is completed the day after C, when the white real body closes far inside the body of the first black candle.
Image 3: Early entry.
Note the flagpole between A and B and the following bull flag. The Morning Star at C speaks for an entry into the trade even before the prices at D break out upwards.

Entering the market after the completion of the morning star pattern instead of waiting for prices at D to break out would have been a clear advantage. Point E, the minimum profit target, is calculated by subtracting the low at A from the high at B and adding the difference to the low at C (the low of the morning star). The theory is that the price will rise at least as far from C as it did from A to B. (This approach is also called a measured move).
Image 4: It hammers higher
Here two successive hammers show a much better entry than the breakout at point E.

Image 4 shows another winning trade based on a mixture of a candlestick pattern and a bullish flag. The mighty prize from A to B (nine white candles in a row) is the flag stand, consequently a bullish flag follows. The candles at C and D are both hammers, which represent bullish reversal patterns in a downward swing. The real body of a hammer is very small (either black or white), its upper shadow is short or non-existent, and its lower shadow is much longer than its real body.
Many traders would buy the trade at E after an intraday breakout from the flag; others would buy near the end of day E when it was very likely that E would close above the resistance line. However, the hammers offer a better entry point: Buy at the opening of candle D (after the first hammer) or at the open of candle D (after the second hammer). The minimum price target (the high at B minus the low at A, added to the low at D) is reached at candle F.
Image 5: Bearish Harami
The Harami at C shows that the rally is over.

Next, we take a look at candle patterns that were created inside Bearish flags. In Image 5, Applera Corporation (ABI) suffered a steep price decline (an inverted mast) from point A to point B and then formed a Bearian flag. Although many traders would sell shortly after the intraday breakout at or near the closing price of D, the Harami pattern at C offered a better entry opportunity.
A Harami is a candle (either white or black, usually the opposite of the previous candle) with a real body that is within the real body of the previous candle. A wise trader could have sold short near the close of Candle C or at the beginning of the next day instead of waiting for a breakout under the flag. The minimum profit target (the high at A minus the low at B, subtracted from the high at Candle C) was reached at E.
Image 6: Opportunity to Shorten
The Harami Cross signals a short position near the high.

Image 6 shows a sharp drop in prices followed by a bearish flag (an inverted flag stand). The candle at point C is a Harami-Cross a candle with a very small candle body that is within the range of the previous day. This Harami Cross indicates that the two-day rally before Candle C should be exhausted and that the underlying downtrend may continue. Instead of waiting to sell at D when the breakout has already occurred, a skilled trader would sell short near the close of Candle C or at the beginning of the next day, as this would give him a much better entry price. At Candle E, AOL reaches its minimum price target (the high at A minus the low at B, subtracted from the high at C).
Intraday trading
This method, the synergetic cooperation of candles and flags, also works well intraday. In the 3-min chart in Figure 7, the stock develops a large and steep flag stand from A to B and then a bullish flag. Candle C is a doji - a candle with the same (or almost the same) open and close. Candle D is a Bullish Engulfing Line - a candle in a downtrend with a white Real Body surrounding the bodies of the previous candles. Both patterns are bullish reversal patterns in the downtrend that started at B. While it is acceptable to buy the breakout at E, the entry after the Doji or Bullish Engulfing Line is the wiser play.
The power of combination
The accuracy and timing of classic bar charts and patterns, from rising triangles to wedges, can be dramatically improved by paying attention to the candlestick patterns that develop within the formations.
Traders who are not concerned with chart patterns should consider installing synergies between the methods they use (e.g. between averages and momentum indicators or between trend lines and gaps).
Always and at all times keep two points in mind: First, the markets do not pay large profits to those traders who all do the same thing. On the other hand, it is very effective, but not very difficult, to combine two different methods with each other, so that they add up to more than the sum of their parts.
Image 7: Successive signals
This 3-min chart shows that a simple flag-candle combination also generates very short term signals. A doji and a bullish engulfing pattern at the bottom of the flag shows potential upward potential.

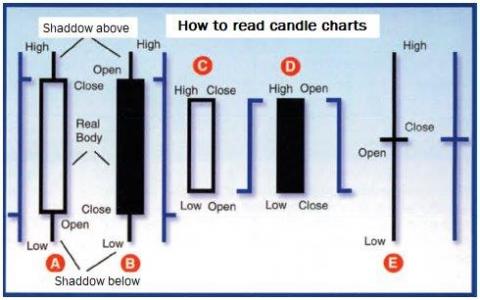
Candlestick Basics
Candlestick charts are easy to read. Note in picture A that the highs and lows of a trading session are logically represented by the highest and lowest points of the candlestick, while the open and glose are the highs and lows of the wider part of the candlestick.
The thin lines at the tops and bottoms are called shadows, and the wider parts are called candle bodies and real bodies, respectively. The candle is white when the end is above the Open and black when the end is below the Open.
Candle A closed above the Open, candle B closed below the Open. Candle C closed above the Open, the Open was the lowest price of the day, the close was the highest price of the day. Candle D shows the opposite. Candle E opened and closed at the same price, the picture is identical to the normal bar chart.
Image A Candlesticks
Here are different candlesticks with the corresponding bar chart equivalents. Candles use the same information as standard bars, but reveal more information highlighting bullish and bearish activity.
Candlesticks examples

A morning star is a bullish reversal pattern in a downward movement. It consists of three candles: a large black candle, a shorter candle (either white or black) with a real body and a gap to the real body of the large candle. This is followed by a large white candle that closes well within the real body of the large black candle. The large black candle confirms the power of the downward movement. The following small real body indicates that the bears have (at least temporarily) lost strength. Finally, the large white candle indicates that the bulls have taken control of the market.
A hammer is a bullish reversal pattern in a downward movement. The real body is very small (black or white), its upper shadow short or non-existent, its lower shadow much longer than its real body. The small Real Bodies above the long tails show that the market has recovered from its lows to close near the highs, a bullish sign. A Harami is a candle (white or black, usually opposite the previous candle) with a Real Body enclosed by the previous candle. It implies a stalemate between bulls and bears, as neither party has been able to pull prices above or below the price of the previous candle.
A Harami Cross is a candle with a very small Real Body that is within the range of the previous day (which has a large Real Body). Keeping the real body within the real body of the previous day, together with the fact that the value opened and closed at the same level, indicates that neither side was able to win the fight between the bulls and the bears on that day.
A doji is a candle with the same (or almost the same) opening and closing price. This pattern demonstrates that neither the bulls nor the bears were able to achieve a sustainable price change.
A bullish engulfing line is a large candle in a downward movement with a white real body that envelops the real body of the previous candle. The bears were at work early on as prices opened at the bottom of the real body, but then the bulls took over as prices rose later in the day and eventually closed at the top of the trading range.
Discover chart formations on the award-winning NanoTrader platform.
"The NanoTrader platform is magnificent." – Kai
"NanoTrader is my fourth trading platform and it is by far the BEST platform." – Henry
"I have already familiarized myself a little bit with the platform and I can tell you, that it is the best trading platform I have ever used." – Peter