
In the section "Key concepts" we explain basic concepts of trading, which are necessary for the understanding of our strategy articles. The aim is to introduce beginners to complex strategies and at the same time give advanced traders the opportunity to refresh their basic knowledge.
Point&Figure charts
With Point&Figure (P&F) charts, the price trend is plotted in columns that are filled alternately with the letters X and O. The price trend is then displayed in the form of a graph. The y-axis is used to display the price values, while the months can be entered on the x-axis as an orientation aid. Depending on the software used, there are the numbers one to nine and the letters A to C within the columns. The numbers one to nine stand for the months January to September and the letters A to C for October to December. If the course falls, you enter O-signs below each other, if the course rises, you enter X-signs above each other. As soon as the sign of the price movement changes, a new column is started, so that no X and O signs can be found in the same column.

Each entry of an X or O on the chart is made in a box. It contains a certain amount, the box size, which has to be defined depending on the price level of the market to be analyzed as well as the time level. The box size also corresponds to the minimum size for another entry on the chart. Based on your personal preferences, you can influence the sensitivity of the chart image yourself. As soon as a trend reverses, a new column is opened on the P&F chart. Since not every smallest correction causes a trend reversal, it is necessary to determine a reversal value, which is also known as a reversal value. This is specified in the number of boxes. The so-called "3 Box Reversal" is the default: The market must therefore correct at least three boxes before a new column can be opened. In general, a buy signal is generated by exceeding the high of the last X column. A sell signal, on the other hand, is generated when the value falls below the low of the last O-column.
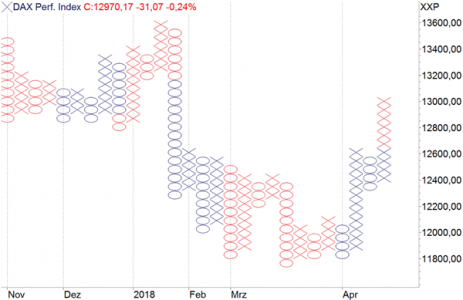
Image 1: The letters X and O are characteristic for the Point&Figure chart. Falling prices are displayed with O signs, rising prices with X signs. As soon as the sign of the price movement changes, a new column is started.
Moving Average
The simplest way to calculate an average is known as the arithmetic mean. The sum of the prices or indicator values of the calculation period is divided by the number of trading days contained. In technical analysis, this value is referred to as the Simple Moving Average (SMA). The Simple Moving Average (SMA) is used just as often today as other types that are more complicated to calculate, such as exponentially weighted MAs (EMA). MAs are used as part of trading systems, as signal lines in indicators and to determine trends in stock, future and index charts. With the EMA in contrast to the GD not all price data are equally weighted and all available price data are considered at the same time. Thus, prices that are outside the selected parameter no longer fall out of the calculation. The EMA is calculated continuously by adding a weighted portion of today's closing price to the value of yesterday's average. Due to the exponential weighting of the added data, the older data "fades" with each day. If you look at an EMA over 20 periods, this does not mean that only the last 20 closing prices are included in the calculation, as is the case with the moving average over 20 periods. It means that the so-called smoothing factor refers to the last 20 periods.
Resistance/support line
If a market falls back several times to (almost) the same level and prices are repeatedly reversed at this point, the technical analysis indicates that this is support. At these points a sufficiently high buying interest arises in order to stop the price decline and to reverse the direction of movement (at least temporarily). Similarly, it behaves at high points with resistance ranges. If a support is broken successfully, usually a bigger sell-pressure follows and thus the confirmation of the trend direction (analogous to this buy-pressure at the break of the resistance). If this confirmation does not occur, it may be a false breakout.

Free newsletter: Trading signals based on technical analysis.
The analysis of the market has become easy! Create your own daily newsletter with signals based on important concepts of technical analysis. All your preferred financial instruments are available.
It's that simple. REGISTER HERE