
In the "Key Concepts" section, we explain basic trading concepts that are necessary, in the first place, for understanding our strategy articles. The aim is to introduce beginners to complex strategies and at the same time give advanced traders the opportunity to refresh their basic knowledge.
Supertrend-Indicator
The super trend indicator is a moving stop and reversal line calculated on the basis of volatility. Simply put, the Supertrend provides information about the prevailing price trend. If the market is above the indicator, there is an uptrend; if it is below the indicator, the market is in a downtrend. The supertrend is similar to the parabolic stop-and-reverse system. It is based on the mean value of the candles and measures volatility as the range between high and low, taking into account any price gaps. Starting from a starting value, the indicator runs in the chosen direction until the market makes a strong movement in the opposite direction with increasing volatility. Then the indicator jumps to the starting value of the opposite direction. The indicator is programmed so that it can only change in the trend direction. Decreasing volatility or movements against the trend direction only result in the indicator being drawn horizontally.
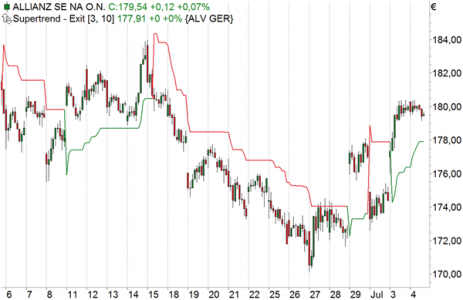
Picture 1: The SuperTrend-Indicator is a moving stop and reversal line, which is calculated on the basis of volatility. Starting from a starting value, the indicator moves in the chosen direction until the market makes a strong movement in the opposite direction with increasing volatility.
Trade price patterns on the award-winning NanoTrader platform.

"The NanoTrader platform is magnificent." – Kai
"NanoTrader is my fourth trading platform and it is by far the BEST platform." – Henry
"I have already familiarized myself a little bit with the platform and I can tell you, that it is the best trading platform I have ever used." – Peter
Fibonacci
A Fibonacci number is the sum of the two preceding numbers. The sequence starts with 0 and 1. All following numbers result automatically: 2, 3, 5, 8, 13 and so on. Fibonacci numbers and ratios often occur in nature; their application in technical analysis also transfers this to the financial markets. Fibonacci Retracements - in the sense of returns/corrections - are determined by first searching for two extreme points in the chart, a low and a high. This distance corresponds to 100 percent of the movement. Based on this, retrace ments are different correction levels such as 38.2, 50 or 61.8 percent. These values result from the formation of different quotients in the Fibonacci number sequence. Similarly, Fibonacci extensions are course extensions.
Moving average
The simplest way to calculate an average is known as the arithmetic mean. The sum of the prices or indicator values of the calculation period is divided by the number of trading days. In technical analysis, this value is referred to as the Simple Moving Average (SMA). Today the simple MA is used just as often as other types that are more complicated to calculate, such as exponentially weighted MAs(Exponential Moving Average; short: EMA). MAs are used as part of trading systems, as signal lines in indicators and to determine trends in stock, future and index charts. With the EMA in contrast to the MA not all price data are equally weighted and all available price data are considered at the same time. Thus, prices that are outside the selected parameter no longer fall out of the calculation. The EMA is calculated continuously by adding a weighted portion of today's closing price to the value of yesterday's average. Due to the exponential weighting of the added data, the older data "fades" with each day. If you look at an EMA over 20 periods, this does not mean that only the last 20 closing prices are included in the calculation, as is the case with the moving average over 20 periods. It means that the so-called smoothing factor refers to the last 20 periods.
Are you looking for an outstanding futures and CFD-Forex broker?

In the annual Brokerwahl traders voted WH SelfInvest as "Nr. 1 Futures Broker" and "Nr. 2 CFD Broker". For an incredible five times in six years WH SelfInvest is considered the best futures broker, beating all competitors by a wide margin. In CFDs WHSelfInvest came only 0,1 behind this year's first-placed broker. Clients are extremely satisfied with the low commissions, outstanding order execution and the legendary service.
Test WH SelfInvest, download a free demo.
Average True Range (ATR)
The True Range and its smoothed version, the ATR, were developed by Welles Wilder Jr. in 1978. Wilder was looking for a way to capture the volatility of commodity and futures markets in one indicator. All methods used to date, such as simple arithmetic averages of the daily trading range, produced insufficient results and neglected gaps between the closing price and the subsequent opening price. In addition, the movements of some commodity futures contracts are limited by limits, which may result in no highs or lows being recorded. The true range is the highest of the three:
1. high (today) - low (today)
2nd high (today) - Closing price (yesterday)
3rd closing price (yesterday) - Low (today)
By default, the ATR is calculated as the moving average of the true range over 14 periods.
