
In the "Key Concepts" section, we explain basic trading concepts that are necessary, above all, for understanding our strategy articles. The aim is to introduce beginners to complex strategies and at the same time give advanced traders the opportunity to refresh their basic knowledge.
Relative strength
A stock has relative strength if it generates better returns than a benchmark index over a certain period of time. Relative strength can be determined by ranking different stocks, by using indicators or by visually comparing the charts of the stock with those of the benchmark index. Many traders include the concept of relative strength (analogous to relative weakness for the short side) in order to derive long and short signals.
Relative Strength Index (RSI)
The Relative Strength Index (RSI) was conceived by Welles Wilder jr. and presented in his 1978 book "New Concepts in Technical Trading Systems". The RSI is calculated according to the formula:
RSI = 100 - (100 / (1 + RS))
With the RSI, the extent of price losses can be compared with the price gains of the same period (Pict. 1).
Bild 1: Relative-Strength-Index

Picture 1: Prices above the 70 mark are considered oversold at the RSI and oversold below the 30 mark.
In the formula RS (relative strength) stands for the quotient of the average of the closing prices of x days/weeks with rising prices and the average of the closing prices of x days/weeks with falling prices. Usually 14 days or weeks are used as the value for x. To determine the mean value of days/weeks with a positive price trend, the total price gains that have accrued within the 14 days/weeks on days/weeks with rising prices 81 must be added and divided by 14. To calculate the average value of days/weeks with a negative price trend, the total price losses incurred during this period on days/weeks with falling prices must be added up and divided by 14. Relative strength is then calculated by dividing the average price gain by the average price loss. The RS is then inserted into the RSI formula.
Are you looking for an outstanding futures and CFD-Forex broker?

In the annual Brokerwahl traders voted WH SelfInvest as "Nr. 1 Futures Broker" and "Nr. 2 CFD Broker". For an incredible five times in six years WH SelfInvest is considered the best futures broker, beating all competitors by a wide margin. In CFDs WHSelfInvest came only 0,1 behind this year's first-placed broker. Clients are extremely satisfied with the low commissions, outstanding order execution and the legendary service.
Test WH SelfInvest, download a free demo.
Candlesticks
Candlesticks are a form of representation of the opening, high, low and closing prices of a period that is easy for the eye to grasp (see Figure 2). The thin lines at the tips and bottoms become shadows, the thick parts are called candle bodies. The candle is green when the end is above the open; red when the end is below the open. One or more of these candlesticks may have characteristic features corresponding to a candlestick formation.
These are often associated with certain signals of rising or falling prices.
Picture 2: Candlesticks
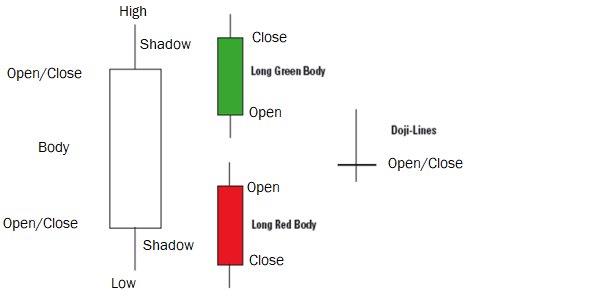
Image 2: The thin lines at the tips and bottoms become shadows, the thick parts are called candle bodies. The candle is green when the end is above the open; red when the end is below the open.
Moving average
The simplest way to calculate an average is known as the arithmetic mean. The calculation is simple: you divide the sum of the prices or indicator values of the calculation period by the number of trading days contained. In technical analysis, this continuously calculated value is referred to as the Moving Average (MA) (or Simple Moving Average, SMA for short; image 3).
Today, the simple MA is used just as often as other types that are more complicated to calculate, such as exponentially weighted MAs (Exponential Moving Average; short: EMA). In general, MAs are used as part of trading systems, as signal lines in indicators and to determine trends in stock, future and index charts. With the EMA in contrast to the GD not all price data are equally weighted, but all available price data are considered at the same time. Thus, prices that are outside the selected parameter no longer fall out of the calculation. The EMA is calculated continuously by adding a weighted portion of today's closing price to the value of yesterday's average. Due to the exponential weighting of the added data, the older data "fades" with each day. If you look at an EMA over 20 periods, this does not mean, as with the moving average over 20 periods, that only the last 20 closing prices are included in the calculation. It means that the so-called smoothing factor refers to the last 20 periods.
Image 3: Exponentially Smoothed and Simple Moving Average


Image 3: The simple moving average (orange) and the exponentially smoothed moving average (blue) over 20 periods can be seen.
Williams %R
The indicator developed by Larry Williams shows the dynamics of the price movement and can be understood as a classic momentum indicator. The current price is related to the trading spread (difference between highest and lowest price) by quotient formation.
The oscillator oscillates between zero and 100. A value of 100 means that the current price corresponds to the period low; a value of zero means that the current price corresponds to the highest price in the observation period. The formula is:
%R = ((period high - closing price) / (period high - period low)) x 100
Since this would generate buy signals in the upper range and sell signals in the lower range, the display in most chart programs is reversed for a more pleasant interpretation and thus corresponds to the "common" indicator display.
Average Directional Index (ADX)
The ADX (Figure 4) is an indicator that represents a determination of the trend strength. While the two sub-indicators +DI and -DI mainly determine the trend direction, the ADX is used exclusively to determine the trend strength. The ADX is the smoothed variant of the Directional Movement Index (DMI), which is calculated from +DI and -DI. ADX values above 20 point to an existing trend. Values above 30 indicate a clear trend, values above 40 are interpreted as particularly strong trends.
Let us briefly summarise the calculation: The two sub-indicators +DI and -DI are determined by first determining the upward and downward price changes. These values are smoothed and divided by the also smoothed true range (see ATR description). The smoothed upward price changes, known as +DM (Positive Directional Movement), divided by the smoothed true range give the +DI (Positive Directional Index). The smoothed downward price changes, known as -DM (Negative Directional Movement), divided by the smoothed true range give the -DI (Negative Directional Index). The DMI is calculated as the absolute value of the difference between +DI and -DI divided by the sum of +DI and -DI multiplied by 100. By default, the ADX is defined as the moving average of the DMI over 14 periods.
Image 4: Average Directional Index (ADX)

Image 4: The ADX shows when a trend prevails (high values) and when it does not (low values). The ADX is the smoothed variant of the Directional Movement Index (DMI) calculated from +DI and -DI.
Average True Range (ATR)
The True Range and its smoothed version, the ATR (Fig. 5), were developed by Welles Wilder in 1978. Wilder was looking for a way to capture the volatility of commodity and futures markets in one indicator. All methods used to date - such as simple arithmetic averages of the daily trading range - produced insufficient results and neglected gaps between the closing price and the subsequent opening price. In addition, the movements of some commodity futures contracts are limited by limits, which may result in no highs or lows being recorded.
The true range is the highest of the following three values:
(1) High (today) - Low (today)
(2) High (today) - Closing price (yesterday)
(3) Closing price (yesterday) - Low (today)
By default, the ATR is defined as the moving average of the true range over 14 periods.
Image 5: Average True Range (ATR)

Picture 5: The ATR shows the volatility of the prices and is defined by default as the moving average of the true range over 14 periods.
