
It is clear to traders and investors that the markets are moving. But the intensity of this movement is often a headache for market participants. The volatility of a market is a central element in the analysis. It provides information about how strong or weak the markets are moving and is therefore very suitable for placing stops correctly. A special type of volatility calculation is the so-called "Average True Range", or ATR for short. We will show you how this is calculated, how it works in practice and how it is used for stopping - in every market phase.
Six market phases
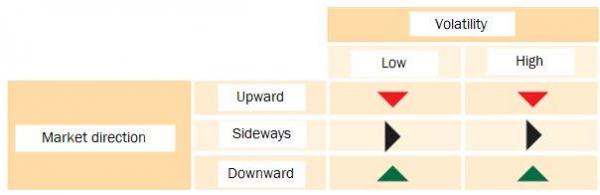
The markets can move in three different directions: upwards, downwards or sideways. In addition, volatility plays a major role: is it high or low? This results in a total of six characteristic market phases that can prevail in the markets (Table 1): The market moves upwards, downwards or sideways with low volatility or it moves upwards, downwards or sideways with high volatility. This subdivision corresponds to the classical understanding of the market structure and covers all situations from the earnings perspective.
Table 1: The six market phases
Try our strategies on the award-winning NanoTrader platform.

"The NanoTrader platform is magnificent." – Kai
"NanoTrader is my fourth trading platform and it is by far the BEST platform." – Henry
"I have already familiarized myself a little bit with the platform and I can tell you, that it is the best trading platform I have ever used." – Peter
The Average True Range
Average True Range means "the average true range". It is considered an indicator of volatility. The range is the range between high and low on a trading day. If, for example, the DAX opens at 5900, then rises to 5950 in the high and finally falls back to 5890, then rises again and closes at 5910, then the spread is 60 points - the difference between high and low. The opening and closing prices are irrelevant. Now we have the range, but not yet the true range. This takes into account in its consideration or calculation that the formation of opinion in the markets does not take place exclusively during the official trading hours. On the contrary: especially in times when the stock markets have closed, an opinion-forming process takes place, which then finds expression in the opening price and often results in so-called "price gaps". If the DAX closed yesterday at 5900 and opened today at 5940, the trading community has obviously gained a positive attitude overnight and is collectively prepared to pay more for the index than at the end of the previous day. The Average True Range is now formed by averaging these values over a period of time. For example, 14 days are common for this.
Calculation of the ATR
This results in the following calculation, where the ATR is the largest of the following three possibilities:
- The distance from today's high to today's low.
- The distance from yesterday's end to today's high.
- The distance from yesterday's end to today's low.
Let us look at a concrete example for the calculation of the ATR (Fig. 1): At D1 the daily span extends into the span of the previous day and is thus the largest of the three possibilities. For D2 and D3, gaps have arisen that are taken into account when calculating the ATR.
Image 1: The three distances

Image 1: With D1, the daily span extends into the span of the previous day and is thus the largest of the three possibilities. For D2 and D3, gaps have arisen that are taken into account when calculating the ATR.
The correct stop setting
Markets do not always move uniformly. There are phases of violent movement that alternate with phases of relative calm. Downtrends are generally faster and more volatile than uptrends. So, as I said before, we have very different situations in the markets, and you have to be flexible to deal with them, especially when it comes to stopping.
Imagine that a day trader in the DAX usually hedges each position with a stop of 25 points.
However, the average fluctuation band, i.e. the ATR, is around 80 points. It is clear that these two parameters do not fit together. The market thus fluctuates at this value around 80 points per day on average. With the 25-point stop, the trader must assume that he is simply stopped out due to random fluctuations. With an ATR of 80 points, we are in a quiet market phase. If the markets are moving correctly, this value may well exceed the 300 mark (as was last the case in October/November 2008). Stops must therefore be adjusted to the current market volatility. The ATR is an excellent tool to define the appropriate distance. In this way, a large number of trades can be eliminated at random. But that's not all: The ATR is also always an indicator for the risk currently prevailing in the market. If the volatility is high, the risk is also high and vice versa. Professional market participants react to such situations by adjusting their position size. With increasing risk, the trade size is reduced; with decreasing risk, more capital can be invested again. For this purpose, the capital invested is made dependent on the stop size and the trade risk can thus be managed quite easily.
The next example is an ATR in the DAX chart: Figure 2 shows the DAX over a period of two years with the ATR in the lower part of the chart. The scale on the right-hand side of the lower chart shows the ATR values in points. The current fluctuation range of the DAX is around 150 points. In contrast, the DAX recorded values of up to 360 points in October and November 2008. This shows you how important it is to keep an eye on volatility and to include it in any considerations about trades or investments.
Image 2: ATR in the DAX
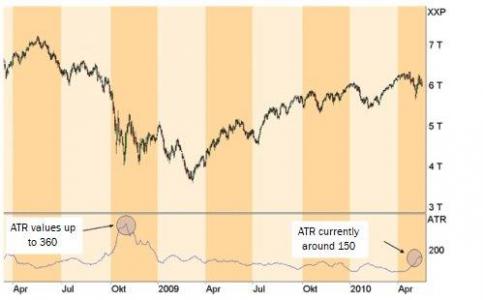
Image 2 shows the DAX over a period of two years. In the lower section you can see the corresponding ATR, some of which can fluctuate considerably. While it currently stands at 150 points, it reached 360 in October and November 2008.
Risk and money management with low volatility
Let us now look at an example of risk and money management with low volatility using ATR. A trader has 10,000 euros of capital at his disposal and his rule is that he does not want to lose more than three percent of his capital per trade, that is 300 euros. Now the trader wants to buy the Allianz share, which is listed at 95 euros and has an ATR of 1.4 (Figure 3, right side). The stop should be greater than 1.4 in order to avoid the risk of accidental stopping. He therefore places the stop a little more than two ATRs away at 92 euros and thus has a risk of three euros per share. Now he divides his risk capital (300 euros) by three and receives the number of shares he can buy with this volatility and the fixed risk: 100 shares. As you can see, our trader can choose a high position size at low volatility. If the price goes against his expectations and falls to 92 euros, he is stopped and loses 300 euros.
Image 3: High and low ATR of the Allianz share
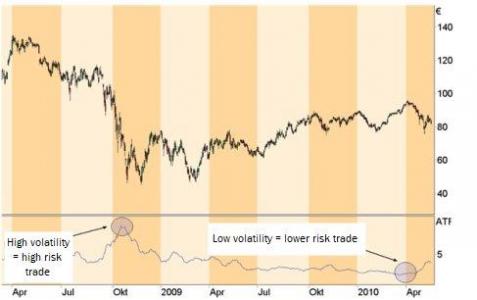
Image 3 shows the Allianz share over a period of two years with the corresponding ATR in the lower part of the chart. While the volatility (ATR ten euros, price 74 euros) and thus the risk in October and November 2008 were very high, the share showed a significantly lower volatility (ATR 1.4 euros, price 95 euros) at the beginning of April 2010 and thus also a lower risk. Depending on the volatility, the trader must adjust his position size in order to keep the risk constant.
More than 100 indicators are available in the NanoTrader with one click as well as more than 60 ready-to-use strategies for direct use. You can test them immediately and free of charge.